Although markets often pause to digest after large gains, history suggests these episodes usually prove fleeting, meaning major indexes could move higher in the second half of 2026.
Anatomy of a Recession
The Long View: A Unique Cycle
Key Takeaways
- The distinct nature of the current economic cycle appears to have tripped up many traditional recession indicators. Several leading indicators have improved over the last six months, including an upgrade of the ClearBridge Recession Risk Dashboard to yellow from red.
- Longer-term shifts such as increased use of fiscal stimulus throughout the economic cycle have helped boost activity over the past few years. Looking ahead, easier lending standards and a pickup in housing activity should help power the economy to a soft landing.
- After a period of historical market concentration, the superior earnings growth of the Magnificent Seven is expected to converge toward the market average over the next two years. This could spark a leadership rotation and broader market participation among the remaining stocks in the S&P 500 as well as small caps.
Current Expansion Shares Little in Common with History
Billionaire investor Carlos Slim once famously opined, “With a good perspective on history, we can have a better understanding of the past and present, and thus a clear vision of the future.” While each economic cycle is unique, they share common elements that can help strategists construct a better mosaic on what to expect moving forward. However, as we progress from a (hopefully) once in a lifetime global pandemic, it has become clear there are more differences between the current economic expansion and history than previously perceived. These divergences have driven an incredibly robust economy over the past two years despite many normally reliable recessionary indicators pointing to an impending downturn. While we remain wary of becoming complacent given numerous risks that abound, the current cycle stands out given the improvement of several leading macroeconomic indicators over the last six months.
One such measure comes from the housing market, which typically moves in tandem with the economy but appears to have decoupled since the pandemic — an unusual dynamic that has only occurred twice before in the 1960s and the mid-1990s. Construction activity experienced a downturn from early 2021 through mid-2023, even as the economy grew rapidly. The current decoupling has seen a unique combination of high prices (largely due to low inventories) but dwindling activity as supply chain bottlenecks and high interest rates weighed on construction. Importantly, housing activity expanded in the second half of last year and this strength appears poised to continue with mortgage rates stabilising and sentiment measures such as the NAHB Housing Market Index survey of homebuilders bottoming.
Another leading indicator showing recent improvement is the Federal Reserve’s quarterly Senior Loan Officer Opinion Survey (SLOOS), which is showing meaningfully less tightening in lending standards for both commercial and industrial (C&I) and commercial real estate (CRE) loans. Although these measures are not yet back into loosening territory, the recent improvement dampens downside risk from restrictive bank lending. Further, we believe investors may be underappreciating the programs the Fed unveiled during last year’s regional banking crisis that prevented the crisis from intensifying and leading to a recession.
Exhibit 1: Lending Standards Getting Better

Gray shading represents recessions. Data as of 5 February 2024, latest available as of 31 March 2024. Sources: Macrobond, Federal Reserve.
The ClearBridge Recession Risk Dashboard has also seen substantial improvement over the past six months, with five underlying indicators improving along with the overall reading. While there were no indicator changes this month, the overall trend remains encouraging and there has been additional progress beneath the surface.
Exhibit 2: ClearBridge Recession Risk Dashboard

Data as of 31 March 2024. Source: BLS, Federal Reserve, Census Bureau, ISM, BEA, American Chemistry Council, American Trucking Association, Conference Board, and Bloomberg. The ClearBridge Recession Risk Dashboard was created in January 2016. References to the signals it would have sent in the years prior to January 2016 are based on how the underlying data was reflected in the component indicators at the time.
It isn’t just the dashboard that has been on the upswing recently. Last month the Conference Board’s Leading Economic Index saw its first positive monthly print end a run of 23 consecutive negative readings. This index tends to lead economic activity and had never previously fallen for this long (or by this amount) without a recession materialising. However, the unique nature of the current economic cycle appears to have tripped up many traditional recession indicators.
"The unique nature of the current economic cycle appears to have tripped up many traditional recession indicators."
For example, many consumers have been insulated from higher mortgage rates given a shift toward fixed rate mortgages following the 2007-2009 crisis. The same can be said for corporate America, where interest payments tend to rise (pressuring margins) alongside Fed tightening campaigns and which often occur late in the economic cycle. However, many companies locked in their borrowing at low fixed rates following the pandemic, and net interest expense has actually dropped — aided by higher returns on corporate cash — over the past few years, despite the Fed’s aggressive hiking campaign. Overall, corporate balance sheets are in good shape, which has so far resulted in less of a need to cut costs (and jobs) compared to past cycles.
Exhibit 3: Large Companies Are Locked In
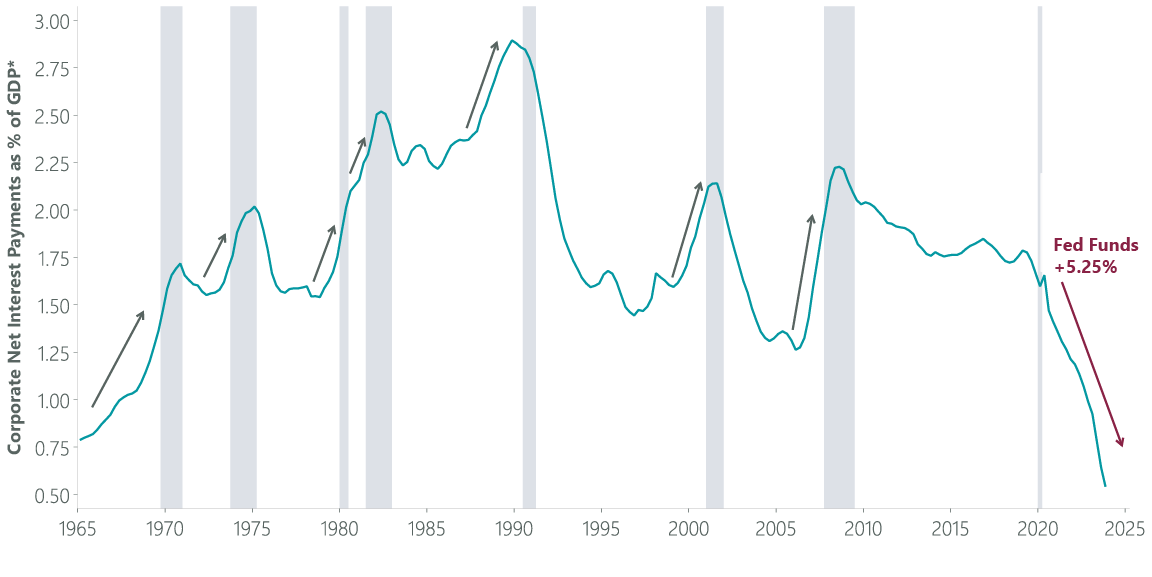
*U.S Nonfinancial Corporate Business, Net Interest and Miscellaneous Payment, Transactions Divided by Nominal Gross Domestic Product (USD). Gray shading reflects recessionary periods. Data as of 28 March 2024, latest available as of 31 March 2024. Sources: Macrobond, Federal Reserve, U.S. Bureau of Economic Analysis (BEA).
Another key economic difference relative to history has been the role of fiscal stimulus. Typically, budget deficits decrease as the economy expands, needing less support, while policymakers deliver stimulus during tougher times often accompanied by rising unemployment. However, the paradigm appears to have shifted around the midpoint of the last economic cycle, with a larger deficit accompanying a healthy economy with a low and declining unemployment rate. This has likely negated many of the headwinds created by tighter monetary policy both in the late 2010s and over the past two years. Looking forward, the fiscal impulse is likely to shrink, but not evaporate, this year, as the Employee Retention Credit payments to small businesses should re-start in late spring alongside modest increases in the federal budget.
Exhibit 4: Huge Deficit, Low Unemployment?
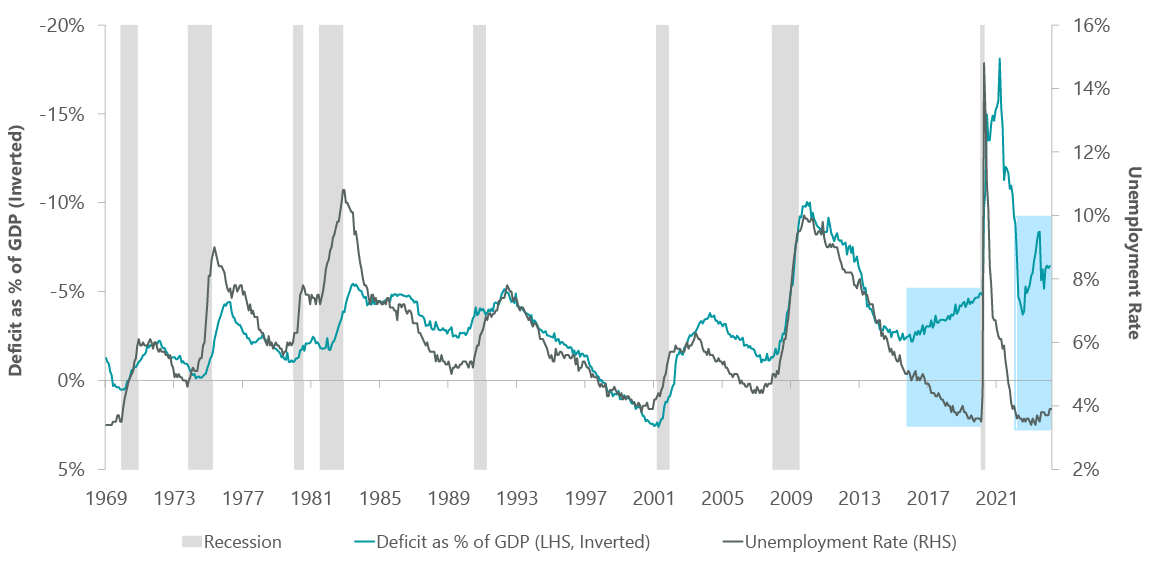
As of 31 March 2024. Sources: BLS, BEA, NBER, U.S. Treasury, Bloomberg.
While a soft landing has been our base case for the past few months, we believe the chance of a recession is higher than the consensus view. Nevertheless, equity investors remain sanguine that a soft landing will come to pass and keep the bull market alive.
On that note, we are encouraged by the market’s behavior so far this year. One development that bodes well for the health of the rally is that the Magnificent Seven stocks are trading less as a monolith than they did in 2023 — a sign the market is re-focusing on fundamentals. In fact, three of the seven members lagged the S&P 500 Index in the first quarter, with two of them suffering losses. In our view, this differentiation bodes well for investors who can discern what has been embedded into these stocks and whether earnings will come through to justify current valuations.
Exhibit 5: The Divergent 7

Data as of 26 March 2024, latest available as of 31 March 2024. Source: FactSet, S&P.
It is important to note that the run for the Magnificent Seven has been underpinned by superior EPS growth at a time when the broader market has been delivering lackluster results. However, the advantage of superior fundamentals is expected to narrow substantially in 2024 and even further in 2025. We believe this could be the catalyst for a more durable rotation that sees the other 493 stocks in the S&P 500 increase participation in a broadening market environment, along with small cap stocks.
Exhibit 6: Mag 7 Advantage Dissipating
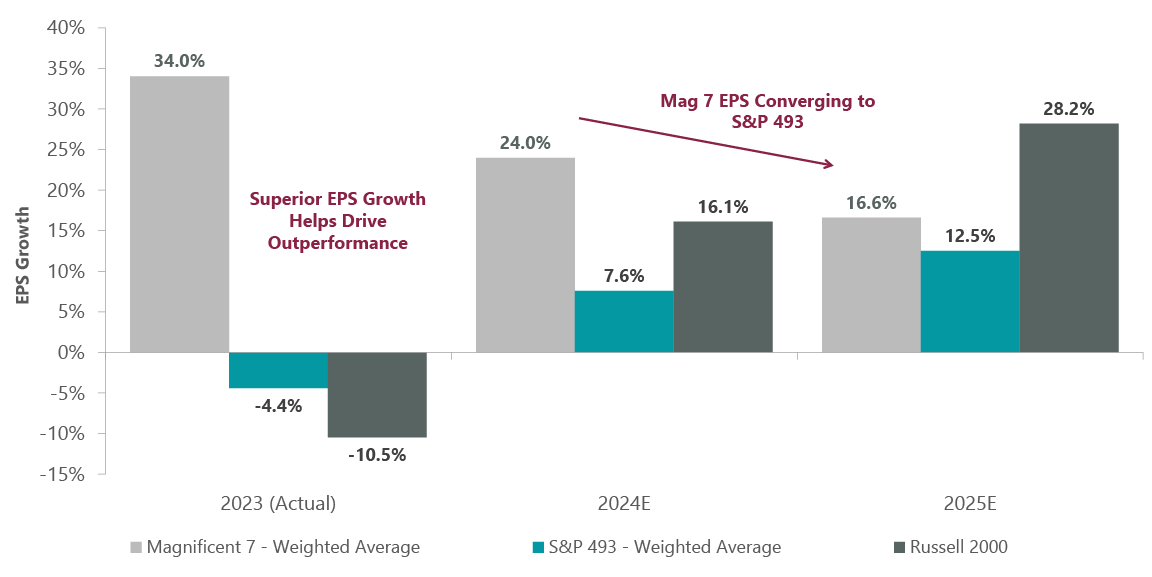
Data as of 31 March 2024. Sources: FactSet, Russell, S&P. There is no assurance that any estimate, forecast or projection will be realised.
The Magnificent Seven and by extension the S&P 500, at 21x next-12-months EPS, are trading at extended valuations. Many investors sitting on cash may be nervous about re-entering an expensive market. However, comparing the market valuation today to history is a bit like comparing apples to oranges due to changes in market composition as well as fundamentals. The S&P 500 has a less volatile earnings stream, less financial leverage and greater profitability than in decades past, all of which support higher multiples. Some of this is due to changes in corporate behavior, but some can also be attributed to shifts in the makeup of the index itself. Today the S&P 500 has less weight in more volatile, asset-intensive cyclical sectors that tend to trade at lower P/Es and more weight in defensive and growth sectors that tend to trade at higher valuations.
Exhibit 7: Index Composition Supports Higher P/Es
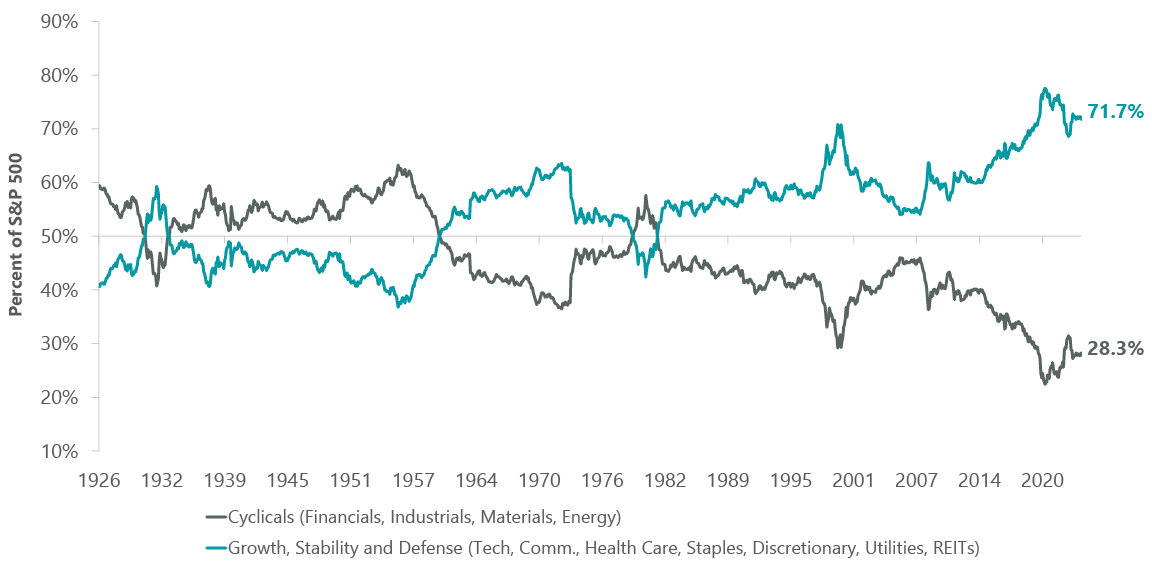
As of 31 March 2024. Sources: Piper Sandler, FactSet, S&P. For illustrative purposes only and not reflective of the performance or portfolio composition of any Franklin Templeton fund.
One additional potential driver of higher multiples is a more flexible Fed that has shifted to using its balance sheet as a policy tool in the wake of the Global Financial Crisis. By employing an expanded toolkit to short-circuit budding crises — such as was done for regional banks last year — the Fed has proven successful in reducing the odds of recessions. A nimbler and faster-responding Fed reduces recessionary tail risks, which should theoretically increase multiples, because the probabilities assigned to recessions and their accompanying earnings declines have been lowered.
In short, historical valuation analysis may not be as helpful as in the past. Just like the unique economic cycle, we may well be in the midst of a unique valuation regime. This isn’t to say the market is cheap, and a period of consolidation would hardly come as a surprise after the equity rally over the past five months. However, long-term investors should take some comfort from the fact that the S&P 500 achieved its first new all-time high in over a year in January, along with several more during the course of the quarter. While all-time highs may incite fear — asking how much better can things get — history shows that deploying capital at peaks has led to better performance than deploying capital when the markets are lower on a 1-, 3-, and 5-year basis since 1989.
Exhibit 8: Don’t Be Afraid of All-Time Highs
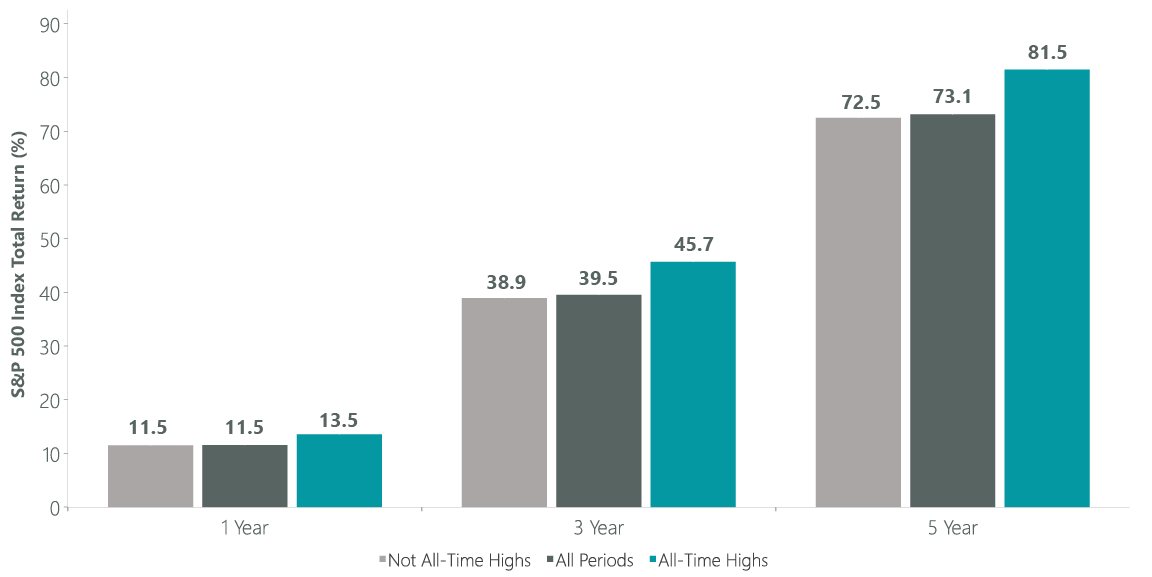
Data as of 27 March 2024, reflective of the period from Sept. 1989 - present. Latest available as of 31 March 2024. Sources: Macrobond, S&P.
With economic indicators continuing to improve and recession risks further ebbing, we believe investors would be best served by focusing on areas of recent relative underperformance such as the S&P 493 and small caps, segments where improving earnings outlooks and less stretched valuations could fuel upside in a soft landing scenario.

Jeffrey Schulze, CFA
Related Perspectives
Anatomy of a Recession
