Although markets often pause to digest after large gains, history suggests these episodes usually prove fleeting, meaning major indexes could move higher in the second half of 2026.
Anatomy of a Recession
AOR Update: Resilience
Key Takeaways
- Consumer and corporate resilience in the face of higher energy costs have supported equity markets, with the S&P 500’s April and May returns ranking among the top 10 strongest two-month stretches since 1950.
- The Profit Margin indicator on the ClearBridge U.S. Recession Dashboard improved last month from yellow to green, and the overall signal remains in green territory.
- Robust corporate earnings should continue to provide a solid market foundation, making us inclined to continue to “buy the dips” should pullbacks emerge.
Consumer Spending, Corporate Capex Provide Solid Footing for Equities
U.S. equities continued to climb higher in May, with the S&P 500 Index rising 5.1%. Further de-escalation of geopolitical tension in the Middle East has paved the way for the market’s 19.5% advance from the late-March lows. Equally important in our view has been the resilience shown by consumers, corporations and the broader economy through the energy price shock.
Prices at the pump have been less forgiving, with the national average gasoline price spending much of May above $4.50/gallon after being below $3.00/gallon before the war. Pain at the pump has weighed on consumer sentiment, with the University of Michigan’s Consumer Sentiment survey reaching a new all-time low in May.
However, we continue to believe that investors are best served by focusing on consumers’ actions rather than their words. To that end, consumer spending has continued to hold up, with Retail Sales remaining green and posting solid gains in both March and April even after excluding gas station purchases. The Profit Margin indicator on the ClearBridge U.S. Recession Dashboard improved last month from yellow to green. Job Sentiment is the only indicator not currently in green territory, and the dashboard’s broad strength remains encouraging.
Exhibit 1: U.S. Recession Dashboard
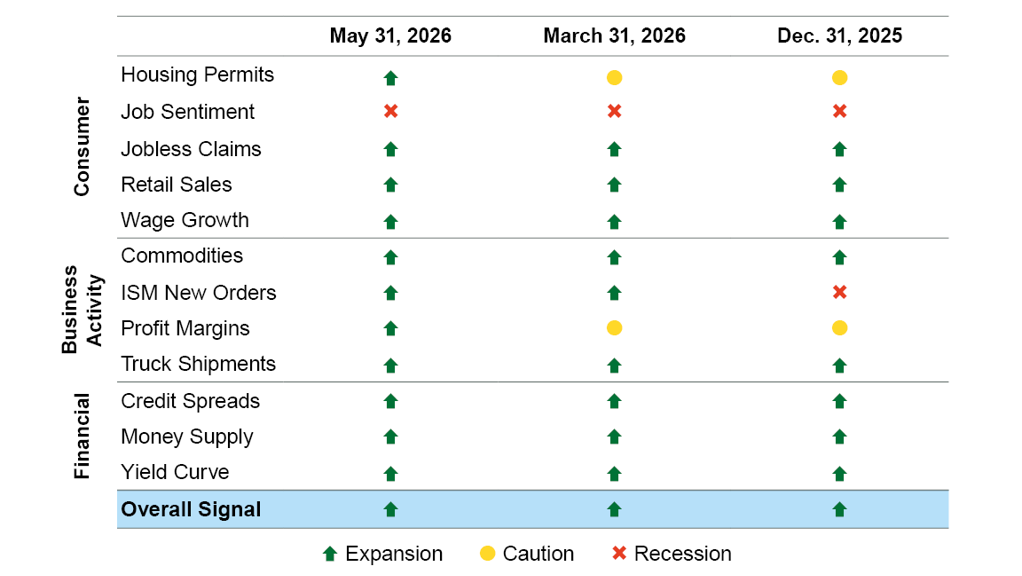
Data as of May 31, 2026. Source: ClearBridge Investments.
In our view, consumer resilience in the face of higher energy costs has come largely as a function of three well-known but underappreciated effects. First, consumption has been driven by the higher-income consumer over the past few years due to the K-shaped economy dynamic. This means wealth effects are helping support consumption on the back of the aforementioned market rally, to say nothing of the broader advance over the past few years.
Second, individual tax cuts from the One Big Beautiful Bill (OBBB) should total well over $100 billion this year between the reduction in taxes paid and refunds issued. Although this dynamic was well understood coming into the year, it appears to have been underappreciated by markets. Third, we believe that many investors do not fully grasp the benefits from declining energy intensity, with energy goods and services spending accounting for just 4% of consumer wallets today.
Exhibit 2: Don’t Be So “Energy” Sensitive

Data last updated on May 28, 2026. Sources: U.S. Bureau of Economic Analysis (BEA), NBER, Macrobond.
It is not just the strength of the consumer that has powered America’s economic resilience of late: corporate capex is also supporting economic growth. Artificial intelligence (AI) investment —data centers require related power, cooling, networking, semiconductor and software infrastructure — now accounts for ~1% of GDP.
Capex is not just limited to AI, however, with several other metrics showing green shoots. These include the ISM Manufacturing PMI survey, which has held above 50 in each of the past five months (and a green dashboard signal for the even stronger ISM New Orders Index), along with inflections in industrial production and core capital goods (non-defense, ex-aircraft) orders and shipments. This pickup in capex is a positive sign and is likely being helped at the margin by the corporate tax incentives from the OBBB.
With consumers and companies continuing to forge ahead, we remain optimistic that markets can continue to rally over the medium term. Endemic to that view is the fact that the market’s upside over the past year has come on the back of improving fundamentals with multiples de-rating modestly. Put differently, equities have climbed higher on the back of stronger earnings, an encouraging foundation for a continuation of the bull market.
History shows that investors should not be scared off by the market’s recent strength, even though the S&P 500’s surge in April and May ranks among the top 10 strongest two-month stretches since 1950. While several similarly sharp rallies have occurred around recessions, many others were rooted firmly within economic expansions, including 1997, 1998, 2019 and 2025. When focusing on non-recessionary periods specifically, history shows that stocks have continued to advance following similar surges, with average returns of 5.3% and 8.5% over the subsequent three and six months, respectively.
Exhibit 3: Strongest Two-Month Rallies

Data as of May 31, 2026. Sources: FactSet, S&P.
Looking ahead, we believe relative containment of the U.S.–Iran conflict and indications that a more lasting peace deal may be nearing could be catalysts for additional market strength. Although bouts of volatility are likely, robust corporate earnings should continue to provide a solid market foundation, making us inclined to continue to “buy the dips” should pullbacks emerge

Jeffrey Schulze, CFA

Josh Jamner, CFA
Related Perspectives
Anatomy of a Recession
