Total Returns Set Infrastructure Apart from Equities and Bonds
Key Takeaways
- Listed infrastructure’s defensiveness relative to other equities and its ability to provide long-term capital growth over an economic cycle relative to bonds offer differentiation in an environment of macroeconomic uncertainty and higher bond yields.
- ClearBridge invests across two defined buckets of listed infrastructure — regulated assets and user-pays assets — whose earnings are governed by regulation or long-term concessional contracts that provide visibility over each company’s ability to generate cash flow.
- Seeking total return through listed infrastructure is important in a world of higher bond yields, as bonds may offer higher income today, but will not be able to offer capital appreciation through the cycle.
The second half of 2023 is set up as a tug of war between still-optimistic market expectations for a soft landing and more cautious economic forecasts that call for a recession. Given the macroeconomic uncertainty globally, we believe the defensive nature of infrastructure, in particular the revenue determination of infrastructure companies, as well as infrastructure’s ability to provide long-term capital growth over an economic cycle — underpinned by predictable and reliable income — make the asset class attractive in a world of higher bond yields.
What Is Infrastructure?
Infrastructure consists of physical assets that provide an essential service to society. These are services we use and interact with every day. For instance, we use gas, water and electricity to carry out our daily activities and rail and roads to get from place to place.
Further, in ClearBridge’s definition of infrastructure, there must also be robust frameworks in place to ensure that the equity holders of the companies we invest in get paid. These frameworks can be regulatory in nature or based on long-term concessional contracts. Both framework structures provide visibility over the company’s ability to generate cash flow.
Broadly, our definition of infrastructure has two buckets: regulated assets and user-pays assets.
For regulated assets, such as water, electric, gas and renewable energy utilities, a regulator determines the revenues that a company should earn on their assets, and revenues typically reflect the size of the company’s asset base, its cost of capital, its operating expenditures and taxes, and an allowance for the capital depreciation of its assets (Exhibit 1). Because demand for these assets is steady and the regulator determines revenue, companies owning and operating regulated assets show a relatively stable cash flow profile over time. Additionally, the regulator periodically accounts for inflation and bond yields, which means price increases are often linked to inflation, and long-term valuations are relatively immune to changes in bond yields.
Revenues for user-pays assets such as railways, toll roads, airports, ports and communication towers, meanwhile, are driven by pricing and volume, with prices generally set by long-term contracts, and volume generally a reflection of economic activity, such as is measured by GDP (Exhibit 2). As an economy grows, develops and prospers, demand for these assets also typically grows.
Infrastructure companies may therefore provide predictable revenue derived from underlying assets. For investors, this offers excellent visibility for revenues and ultimately earnings and dividends.
Exhibit 1: Regulated Asset Revenues: U.K. Water Utilities

*Average of each revenue component for 2015-2020 regulatory period. Source: Ofwat, internal calculations.
Exhibit 2: User-Pays Asset Revenues: A Toll Road Operator

Source: Transurban, internal calculations. FY19 revenue breakdown.
Earnings Stability and Certainty
Infrastructure’s expected resilience in different macroeconomic environments provides stability of earnings: using the Global Listed Infrastructure Organisation (GLIO) index as a proxy, over the past two decades, there has only been one instance of negative year-over-year EBITDA growth for infrastructure (Exhibit 3).
Exhibit 3: Year-Over-Year EBITDA* Growth for Infrastructure and Global Equities (1999-2022)

*EBITDA is earnings before interest, taxes, depreciation and amortisation. This earnings measure removes some of the impact of different accounting standards applied across different regions and sectors.
As of 31 December 2022. Source: Global Listed Infrastructure Organisation (GLIO). Comparison of Year-on-Year EBITDA for the GLIO Index (Infrastructure) and MSCI World Index (Global Equities).
Given demand for regulated and contracted utilities is steady and a regulator determines the revenue, these companies have a fairly tight range of annual earnings growth (Exhibit 4). Due to their essential nature and predictable pricing, user-pays assets also have a tighter range of earnings growth relative to general equities.
Exhibit 4: Forecasted Earnings Growth for 2024-2025 for Different Types of Infrastructure and Equities

As of 30 June 2023. FY2023-24 refers to the current unreported year; FY2024-25 refers to the next reporting year. Utilities and user-pays: RARE Income Universe excluding emerging markets, due to lack of sell-side coverage. ACWI: MSCI AC World Index excluding emerging markets, due to lack of sell-side coverage. NASDAQ100: Nasdaq-100 Index. Box plot represents quartiles, with first and fourth quartiles unshaded and bounded by minimum and maximum forecasts (bottom and top lines), and middle quartiles shaded. The median forecast is marked by the horizontal line in the box; the average is marked with an x. Source: ClearBridge Investments, FactSet consensus estimates – current unreported year versus the following year.
Further, due to their regulated nature, utilities results can be generally forecasted with greater certainty relative to general equities. Looking at the earnings range (expressed in %) of the most bullish and bearish sell-side broker for companies within each sector, there are less discrepancies among the sell-side brokers for utilities (Exhibit 5). Compared to utilities, there is relatively greater uncertainty for user-pays assets’ earnings growth given the less predictable volume component, although user-pays assets have a tighter range of forecast differences than general equities.
Exhibit 5: Consensus Earnings Forecast Ranges

As of 30 June 2023. FY2023-24 refers to the current unreported year; FY2024-25 refers to the next reporting year. Utilities and user-pays: RARE Income Universe excluding emerging markets, due to lack of sell-side coverage. ACWI: MSCI AC World Index excluding emerging markets, due to lack of sell-side coverage. NASDAQ100: Nasdaq-100 Index. Box plot represents quartiles, with first and fourth quartiles unshaded and bounded by minimum and maximum forecasts (bottom and top lines), and middle quartiles shaded. The median forecast is marked by the horizontal line in the box; the average is marked with an x. Source: ClearBridge Investments, FactSet consensus estimates – high versus low.
Investing in Infrastructure for Total Return
As demonstrated, utilities and user-pays revenues and earnings are relatively stable and predictable. In times of economic stress, then, infrastructure assets in listed markets should provide defensive exposure. The compound effect of this defensive exposure in down markets, coupled with appropriate upside participation, especially from the GDP-dependent user-pays assets, has enabled infrastructure to achieve attractive total returns historically.
In ClearBridge’s definition of infrastructure, as expressed in our proprietary RARE Income Universe, we believe it is necessary to understand the quality of an infrastructure company’s assets as well as the regulation and contracts governing them. Active infrastructure managers can focus on companies in such a universe that have proven their ability to grow capital through the economic cycle, that can offer total returns through both dividends and capital appreciation, and that can, through this combination, outperform major asset classes with less risk than broad equities (Exhibit 6).
Exhibit 6: Total Returns for Infrastructure Versus Other Asset Classes
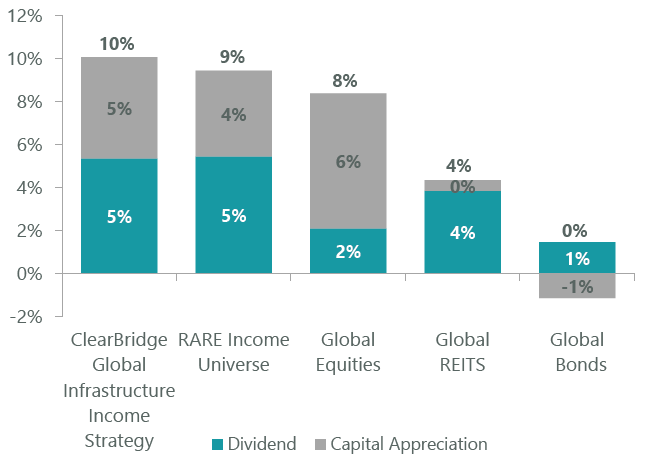
Since inception of ClearBridge Global Infrastructure Income Strategy (31 October 2010 to 30 June 2023). RARE Income Universe represents ~170 infrastructure companies chosen using a proprietary methodology based on visibility and predictability of cash flows and a minimum level and quality of dividend yield. Total Returns in USD. Index used for Global Equities: MSCI AC World Index; Global REITS: FTSE EPRA/NAREIT Global; Global Bond: Bloomberg Global Aggregate. Source: ClearBridge Investments, FactSet.
While global equities can provide attractive capital returns and REITs can provide attractive yields, both have revenues and, ultimately, earnings and dividends, that are closely linked to economic activity. We believe infrastructure has an edge as a long-term total return solution due to the stable revenues it derives from the underlying assets of these companies.
Seeking total return is important in a world of higher bond yields, as bonds may offer higher income today, but will not be able to offer capital appreciation through the cycle. In a deteriorating economic environment, resilient income, derived from stable earnings frameworks of regulated infrastructure assets, and exposure to economic growth through user-pays assets, can contribute to strong total returns, making listed infrastructure an attractive investment proposition.

Related Perspectives

Global Infrastructure Income Strategy Commentary Q2 2026
Infrastructure Positive but Trails in Risk-On Quarter
Listed infrastructure made positive gains, led by user-pays assets such as airports and rail in a risk-on environment of easing geopolitical tensions.