Although markets often pause to digest after large gains, history suggests these episodes usually prove fleeting, meaning major indexes could move higher in the second half of 2026.
Anatomy of a Recession
The Long View: Inflationary Riptide or Reflationary Current?
Key Takeaways
- The ClearBridge Recession Risk Dashboard continues to flash an overall green expansionary signal, with one positive signal change in March as Profit Margins improved to green. We expect further improvement in the weaker areas of the dashboard as we move through the second quarter.
- With a healthy consumer, accommodative policy, accelerating GDP and the potential for herd immunity from COVID-19, the risk of an inflationary overshoot has increased. We believe any inflation scare, however, will be short-lived.
- The Fed’s average inflation targeting stance has some investors worried about the possibility of runaway inflation reminiscent of the 1970s, yet the disinflationary effects of globalization and technology should act to keep long-term inflation in check, making current reflationary efforts supportive of equities.
New Bull Markets Thrive in Tepid Recoveries
The bull market celebrated its first birthday on March 23 with its 75% price return marking the strongest 12-month run for the S&P 500 Index over the last 75 years. While there’s been plenty of ink spilled on how unique this crisis has been, it has been a fairly ordinary market environment to this point in the cycle. The first year of a bull market typically provides returns well above long-term averages with minimal turbulence. This period seems incongruent because the market is up substantially against the backdrop of a struggling economy. The second year, on the other hand, still provides above-average gains but the market’s path forward tends to be much more labored, even in a stronger economy.
Exhibit 1: The Terrible Twos?
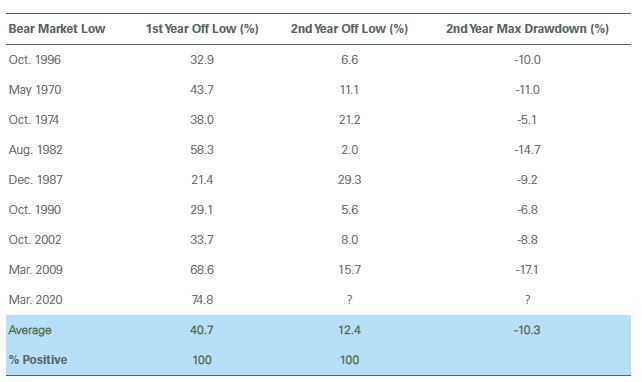
Data as of March 29, 2021. Source: FactSet.
While the next leg of the current bull market may be more turbulent, the U.S. economy remains in the early stages of a new expansion, which should provide a tailwind for risk assets over the coming years. Both fiscal and monetary policy should remain supportive in the coming quarters, meaning investor attention will be largely focused on any signs of emerging macro weakness that could lead to a downturn in earnings. A series of recent economic releases came in below expectations due to adverse weather conditions in much of the South and Midwest in the month of February. Markets have largely looked through these distortions, and the ClearBridge Recession Risk Dashboard continues to flash an overall green expansionary signal. Profit Margins improved from yellow to green this month, and as we move through the second quarter, we expect further improvement in the four remaining non-green signals.
Exhibit 2: Recession Risk Dashboard
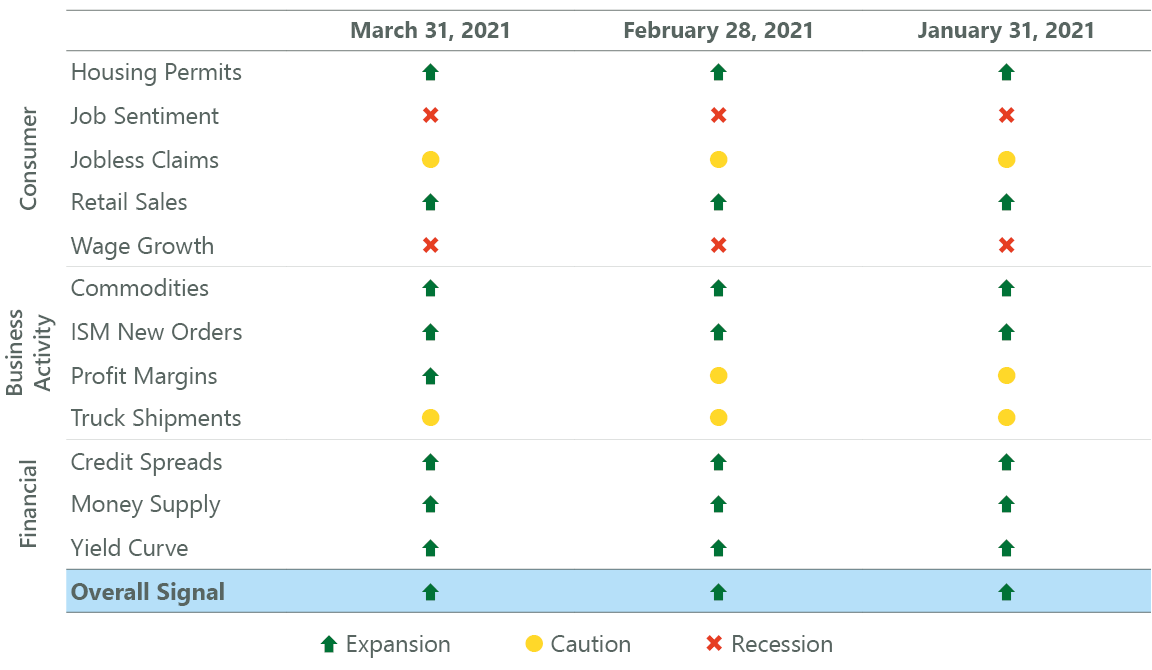
Data as of March 29, 2021. Source: FactSet.
Policy has been a key catalyst for the stock market rally, jumpstarting the recovery process more quickly and in greater size relative to past recessions. This dynamic was underappreciated by many market participants initially, including ourselves. Policymakers seem intent on extending support until the economy is clearly on firm footing, as evidenced by the $400 billion allocated directly to consumers via the $1,400 economic impact payments (EIP). This sum is 2.5x the size of the $130 billion in total EIP approved in the December stimulus bill, a package that resulted in a blockbuster January retail sales number of +5%. The combination of this materially larger EIP and an economy that is reopening should supercharge consumer spending in the coming months. Further upside could come from another stimulus package focused on longer-term infrastructure spending that is beginning to be debated.
Not all of these stimulus payments will be spent immediately, however. A large share of past stimulus payments were saved, which combined with an inability to spend has driven an excess savings accumulation of nearly $2 trillion. This cash hoard, along with a 10% increase in household net worth over the past year should provide fuel for above-trend economic growth in the coming year and potentially beyond, a dynamic we explored Long View.
Policymakers Have Thrown in Kitchen Sink to Spur Recovery
Monetary policy has been an important component for the economic recovery beyond fiscal spending, and the coordinated direction between them has served to amplify the effect of each. Total economic stimulus in the U.S. over the past year has amounted to an equivalent of $43,000 per household. The overall outlay is larger than the estimated cost in current dollars of World War II, and the Fed has executed more bond buying over the last year than the combined efforts of Bernanke and Yellen following the global financial crisis (GFC).
Exhibit 3: Not Your Father's QE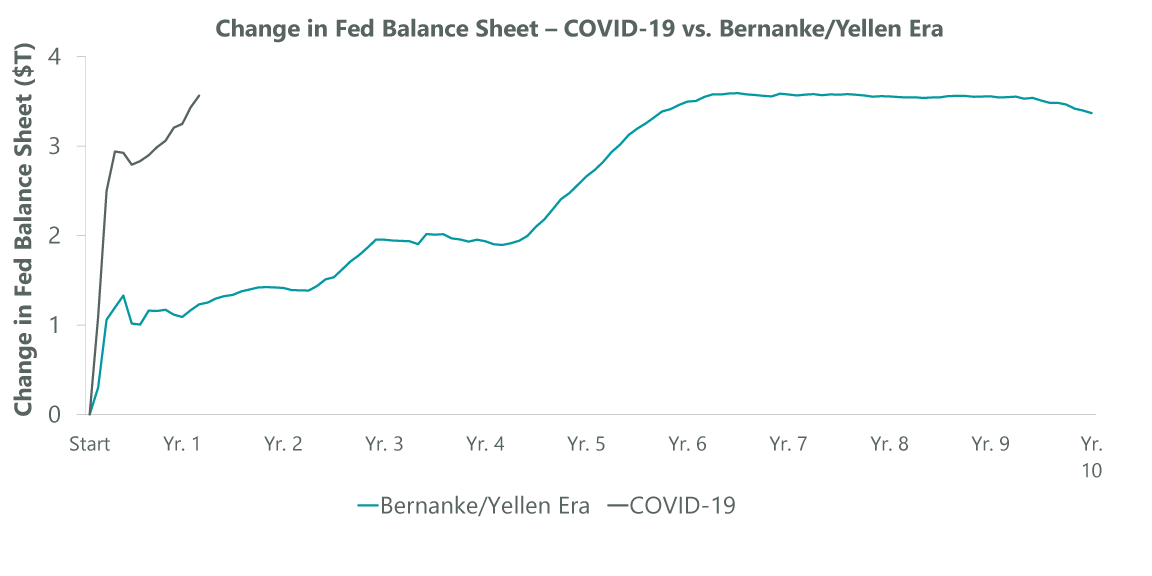
Data as of March 24, 2021. Source: Federal Reserve and Bloomberg
The economy is poised to accelerate in the coming months as herd immunity is attained. Economic activity has been closely linked to mobility through the COVID-19 crisis, and as reopening occurs, pent-up demand for services should be released. This should also help drive a more robust labor recovery, where over 75% of net job losses have occurred in COVID-19-sensitive industries such as hospitality and retail. The last two jobs reports could prove a glimpse of what might come in the months ahead, with hospitality and leisure generating 384,000 out of 468,000 private sector jobs created in February and 280,000 of the 916,000 new jobs added in March. With over 2 million people still on furlough (temporary layoff), more payroll reports approaching one million like we saw this past month are not out of the question. In fact, consensus sees the economy adding roughly a half million jobs every month in 2021 and the Fed dot plot implies a 4.5% unemployment rate by year-ends
Exhibit 4: A Tale of Two Labor Markets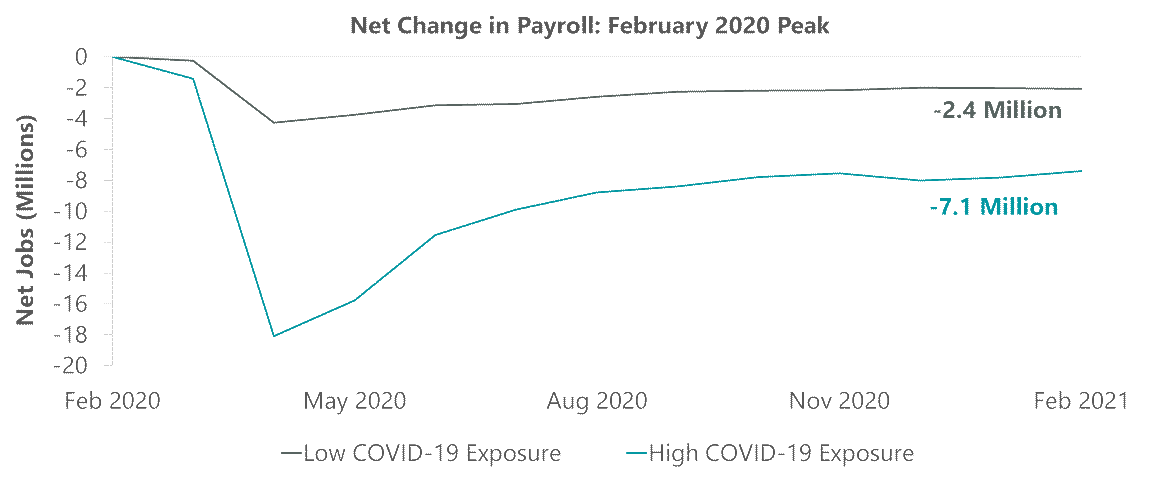
High and low COVID-19 exposure is based on industry-level data measuring data including the ability to work remotely, essential vs. non-essential status, and supply/demand shocks resulting from the COVID-19 pandemic. Aggregate net change in payroll employment in these industries is measured relative to February 2020 peak employment levels. High COVID-19 exposure industries account for ~60% of pre-pandemic total non-farm payroll employment; Low COVID-19 exposure industries account for ~40% of pre-pandemic total non-farm payroll employment. Data as of Feb 28, 2021, latest available as of March 31, 2021. Source: Bloomberg, BLS, INET Oxford.
With a healthy consumer, supportive policy and GDP accelerating as herd immunity comes into view, the risk of overheating that could lead to inflation has increased. Consensus expectations are for 2021 to be the strongest year of GDP growth since 1984 (and possibly 1951). A near-term inflation scare seems likely in the coming months due to a combination of base effects (lapping year-ago easy comparisons during the initial shutdown) as well as stronger demand outlined above and supply chain bottlenecks. This is more a U.S. phenomenon than a global one, given the larger U.S. stimulus response as well as the stronger expected recovery on the back of an earlier timeline for herd immunity.
Exhibit 5: Inflation Scare Primarily a U.S. Phenomena 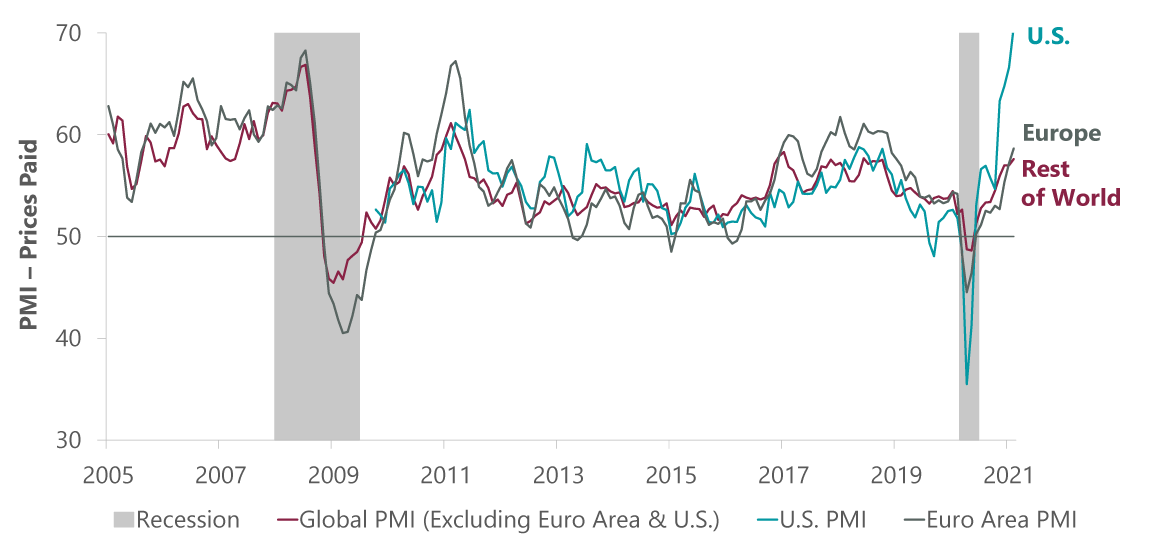
Data as of Feb. 28, 2021, latest available as of March 31, 2021. Source: Bank of America, IHS Markit, NBER.
Beyond an initial price spike, inflation is expected to cool over the intermediate term. Capacity constraints should ease as supply chains are repaired and supply/demand imbalances self-correct. Some pockets of strength within goods should ease as consumer preferences shift and additional capacity should also come online as workers are rehired. There was a similar inflation scare in 2010 in the aftermath of the GFC. One-time price adjustments from depressed levels looked like inflation but the underlying trend in core inflation remained flat. Furthermore, a period of disinflation in the two-to-three years following recessions is typical, despite easy comps and economic acceleration.
Exhibit 6: Inflation Rare Early Cycle 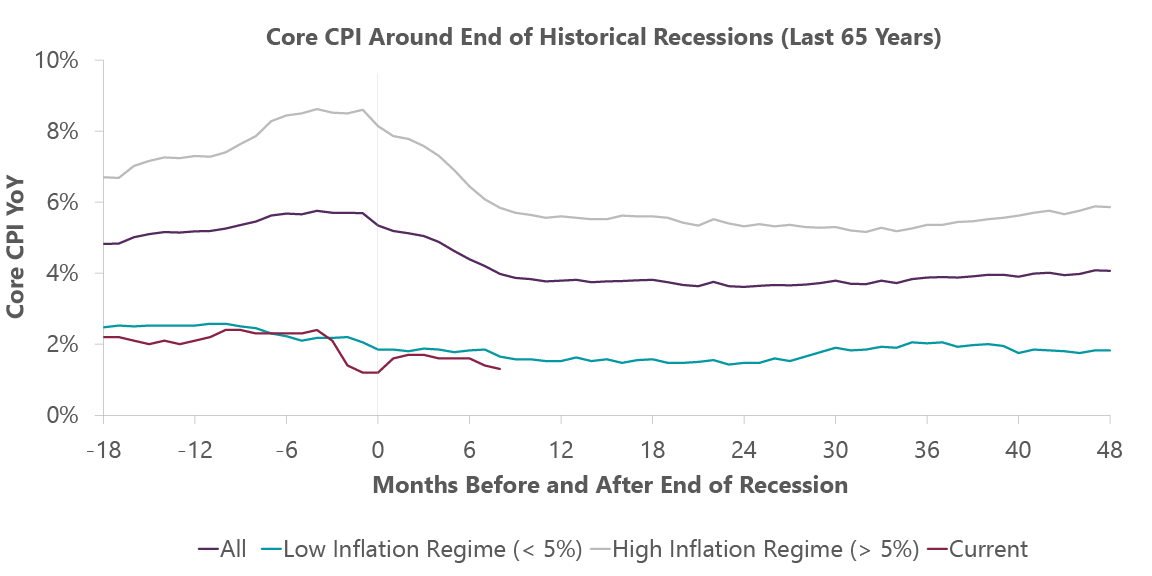
Note: High/Low Inflation Regime based on Inflation Over/Under 5% at End of Recession. Data as of Feb. 28, 2021, latest available as of March 31, 2021. Source: BEA, NBER, Bloomberg.
Another sign that inflation may remain muted longer term is coming from the bond market. Inflation expectations derived from the pricing of Treasury Inflation-Protected Securities (TIPS) relative to “normal” Treasurys at the same maturity show that investors are expecting higher inflation over the next five years (2021–26). However, looking out further, inflation expectations are expected to fall over the following five years (2027–32). This supports the notion that any bout of higher inflation will ultimately prove transitory, and perhaps more importantly that the Federal Reserve remains credible in its commitment to re-normalize policy once its goals are achieved. Put differently, a regime shift toward higher inflation over the long run is not currently being priced in by the bond market.
Exhibit 7: Long-Term Inflation Not a Concern 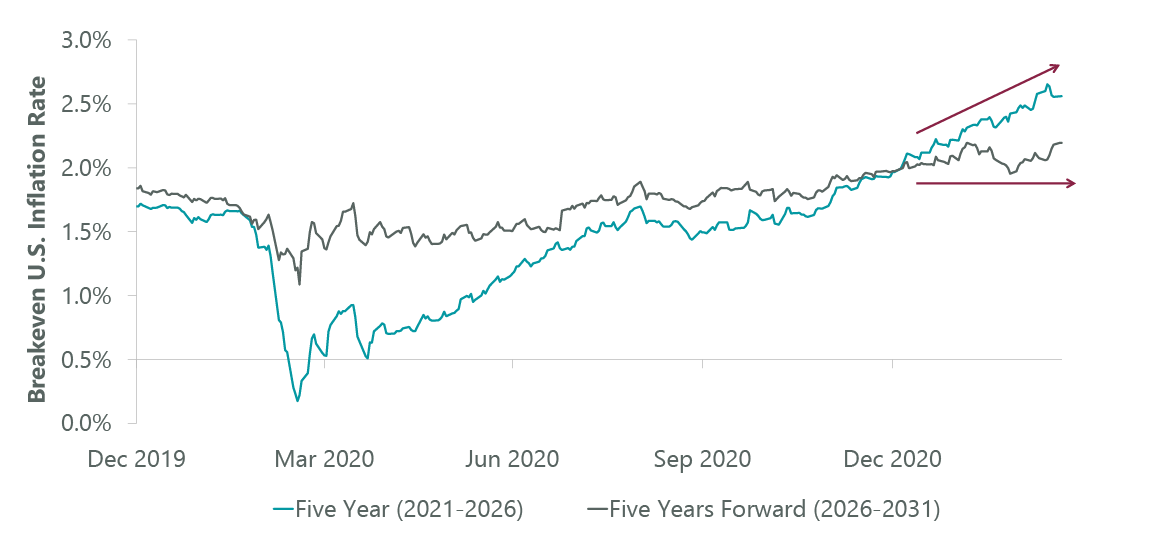
Five year represents period from April 2021 - April 2026; five years forward represents period from April 2026 - April 2031. Data as of March 23, 2021. Source: FactSet.
Secular Inflation Less of a Worry
This presents a risk, as the U.S. could be on the path toward an inflationary regime shift. The Fed is now explicitly targeting higher inflation and there is a risk it “falls behind the curve” where inflation moves higher than it would prefer. This could fuel further price increases as investors fear that inflation might not be brought under control for several years. In economics-speak, this is termed inflation expectations becoming unanchored from the 2% long-run target (as opposed to a short-term overshoot). This was exactly the backdrop seen in the 1970s, a period characterized by easy monetary and fiscal policy with policymakers accepting the inflationary rise, creating a self-perpetuating inflation feedback loop.
However, there are several key differences between the 1970s and today. First off, structurally disinflationary forces such as globalization and technology were less prominent 50 years ago. A more global business environment has meant more international competition, which limits how aggressively companies can raise prices, while continued innovation means companies can find new ways to lower their costs. Further, inflation expectations have become more anchored given greater central bank credibility and independence. The labor market has also become more flexible given falling rates of union membership, leading to slower wage gains. Finally, policymakers in the 1970s implemented price controls that temporarily stemmed the issue but ultimately proved damaging when the controls were loosened and pent-up inflation was released. In the end, these forces mean that while the U.S. will likely experience stronger inflation in the near term than the rest of the world, it is unlikely to be reminiscent of the Great Inflation of the 1970s.
A reflationary current morphing into an inflationary riptide is just one of three primary concerns investors appear to be weighing. The other two are the prospect of higher taxes and interest rates. On taxes, the next round of fiscal stimulus and accompanying “pay-fors” is just beginning to be debated. This should provide an initial glimpse into potential tax ramifications for both individuals and corporations. While any package is not expected to be passed until the middle of the third quarter at the earliest, this could lead to a moderate repricing of equities as investors attempt to handicap what might be included in any final bill.
The final investment risk is the prospect of higher interest rates. During the first two years of an economic expansion, it is common to see interest rates rise in anticipation of increased growth and inflation. Although many interpret higher rates as a negative (tighter financial conditions), against a stronger growth backdrop, their impact is partially or even fully offset by a stronger profit environment. For example, any impact from higher rates on demand in interest-rate-sensitive areas, like housing, needs to be considered within the context of a stronger labor market with rising wages along with other factors like demographic trends and home prices. Interest rates are typically only a single piece of the overall puzzle. In other words, higher rates (particularly from low levels) are tolerable when they are rising for the “right” reasons like strong economic (and corporate profit) growth and moderate inflation. In fact, equity markets have historically performed quite well during periods of rising long-term interest rates.
Exhibit 8: Higher Rates, Higher Equities
Source: FactSet.
Putting this all together, we believe financial markets and the economy are undergoing a period of transition. It would not be uncommon to see greater volatility in equities given the strong economic backdrop and prospect of higher rates and inflation. It will not be clear what (if any) persistent new trends emerge in the wake of the COVID-19 crisis for several years, but the chances of a regime shift are as great today as they have been in over a decade. Regardless of the long-term outcome, the reflationary period that needs to occur before inflation has traditionally been an attractive time for investment in risk assets.

Jeffrey Schulze, CFA

Josh Jamner, CFA
Related Perspectives
Anatomy of a Recession
