Consistent Alpha Through Fundamental "Active Insights"
For the ClearBridge Australian equities investment team, our overarching philosophy is that the Australian equity market is efficient over the long term, but in the short to medium term, behavioural biases can create dislocations, temporary mispricing and divergences from fair value. In recent times the impact of flows and indexing can be added to the list.
With many active managers recently underweight size and banks, asset owners often pose the question as to how investors are tackling these issues with an eye to both risk and alpha opportunities in the Top-20.
In the following paper, we outline some challenges investors are facing in their Australian Equity allocation, including the impact of increasing passive flows. We aim to address some of these issues and outline a unique solution from our investment team.
We believe an active fundamental solution can offer significant risk-adjusted value-add relative to a traditional passive or systematic approach.
Market Dislocation: Impact of Index Flows on Alpha
Has Indexing Changed the Market Structure?
Many actively managed funds have underperformed their index benchmarks over the last 15 years, regardless of the region where the funds are domiciled. One possible rationale for the reduced efficacy of fundamental active management has been the increased dominance of passive or index-sensitive products that are indifferent to fundamentals, and instead allocate based solely on market price and recent momentum. It is argued that regulatory changes encouraging greater use of capitalisation-weighted index portfolios may have created distortions in market structure that have increased the co-movement of stocks in the same index, diminished diversification and eroded price discovery1.
In Australia, we are seeing the increasing dominance of index-aware strategies leading to falling ownership by not of active fund managers, and consequentially falling turnover of some of Australia’s largest index stocks. We have analysed the proportion of daily stock turnover that we can attribute to index-sensitive buying. In aggregate, we estimate that more than 25% of the daily turnover for certain stocks is currently related to indexsensitive buying, compared with less than 15% five years ago.
The turnover impact is evident amongst the Top-20 names. For example, we have found that the volume of Commonwealth Bank of Australia (CBA) shares traded is down 35% versus pre-Covid, and Wesfarmers is down more than 45%. This falling turnover and larger number of investors willing to trade to match an index, regardless of price, is creating a persistent upward bias to price discovery of the most impacted stocks. This distortion is most evident when markets are quiet and there are fewer information traders, i.e. periods when markets are trending up, less volatile and have limited incremental company news flow. These conditions are potentially an explanation for the large divergence in price to fair value for stocks like CBA (Exhibit 1) and Wesfarmers.
Exhibit 1: Turnover and Volume - CBA
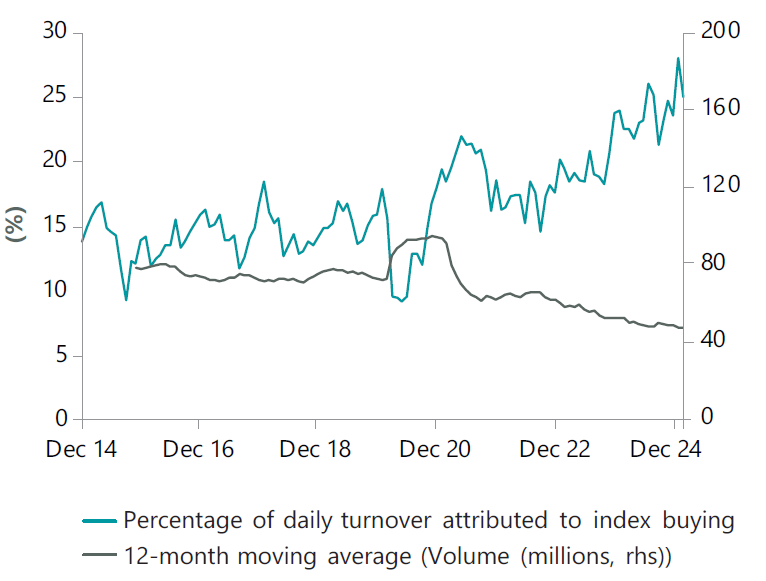
Source: ClearBridge, FactSet; as of 12 March 2025. *Top index flow stocks: selected based on proprietary analysis of expected daily percentage buy turnover attributed to index daily.
The information provided should not be considered a recommendation to purchase or sell any particular security. It should not be assumed that any of the security transactions discussed here were, or will prove to be, profitable. References to particular industries, sectors or companies are for general information and are not necessarily indicative of a fund’s holding at any one time. Past performance is not a guide to future returns.
With the increased weight of index buying, we have identified a phenomenon, which we are calling ‘gap pricing’, that is becoming more profound. This is where prices and index weights of the Top-50 stocks have run up due to index flows, then when the market sees new information on a stock, such as an earnings result surprise, or a key macro change, the volume of shares traded would increase. As a result, the impact of index buying in setting the price should diminish, overpowered by the trading based on the new information. This results in small levels of negative information or ‘news’ causing large price reactions. For example, during the February 2025 reporting season, we saw this with National Australia Bank, Goodman Group, CSL and Westpac Banking Corporation, which each had very minimal earnings downward revisions, i.e. very little incremental information, but had a near -10% two-day price reaction (Exhibit 2).
Exhibit 2: February 2025 Reporting Season
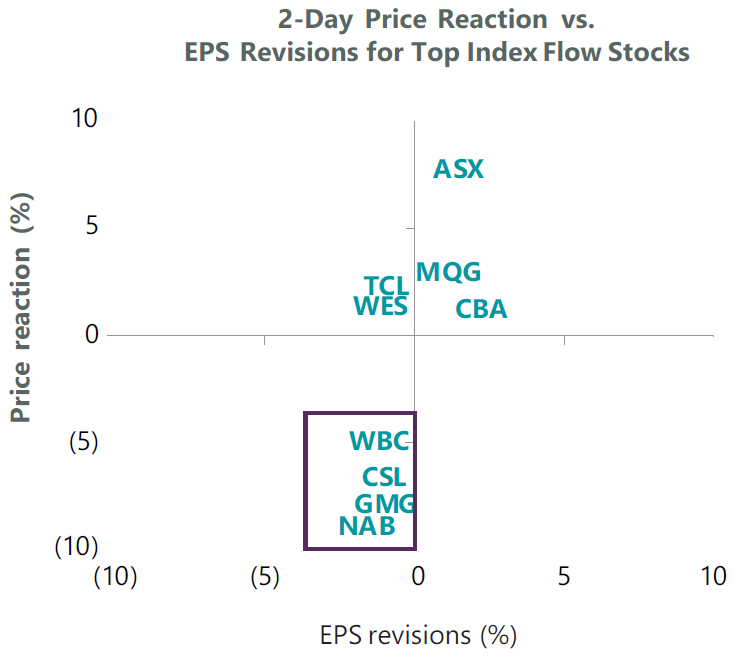
Source: ClearBridge, FactSet; as of 12 March 2025. 2-day price reaction: difference between company reported results and the S&P/ASX 200 Accumulation index over the two days following result. Revisions: companies with a +/-2% change in broker consensus next 12-month (NTM) forecasts after companies have reported their results.
The information provided should not be considered a recommendation to purchase or sell any particular security. It should not be assumed that any of the security transactions discussed here were, or will prove to be, profitable. References to particular industries, sectors or companies are for general information and are not necessarily indicative of a fund’s holding at any one time. Past performance is not a guide to future returns.
Keeping the Core “True to Label” in the Face of the Index Flow ‘Factor’
There is mounting evidence that these impacts create another market dislocation that active managers may be able to exploit. Our research into how best we, and other, active managers can exploit this phenomenon is early in its evolution, however it seems clear that controlling factor exposures to account for this index flow-induced gap pricing could be valuable for many portfolios and to keep investors’ core Australian equity exposures “true to label”. In this note, we illustrate the process enhancements we have implemented to decouple the ‘pure’ fundamental analyst insight from the systematic style factor exposures implicit in prices to create true style neutral portfolios. This is the approach we incorporate into our ClearBridge Australian Active Insights strategy.
Isolating True Pure Alpha from Style Factors
The investment process for all Australian equity strategies and solutions, including ClearBridge Australian Active Insights, starts with bottom-up fundamental research by our dedicated sector analysts of each of the S&P/ASX 200’s constituents. Our approach recognises the importance of multiple drivers in generating returns, and we have designed a framework to capture forward-looking fundamental and qualitative insights across multiple proprietary research lenses.
Each of these proprietary research lenses has a track record of providing significant value-add potential when compared to traditional Fama-French and other style factors. Blending the outputs from the research lenses to create risk-adjusted expected returns in a customised manner allows us to align stock selection and portfolio construction with client objectives, as illustrated in Exhibit 3.
Exhibit 3: Our Proprietary Research Lenses Offer a Premium Over Common Factors
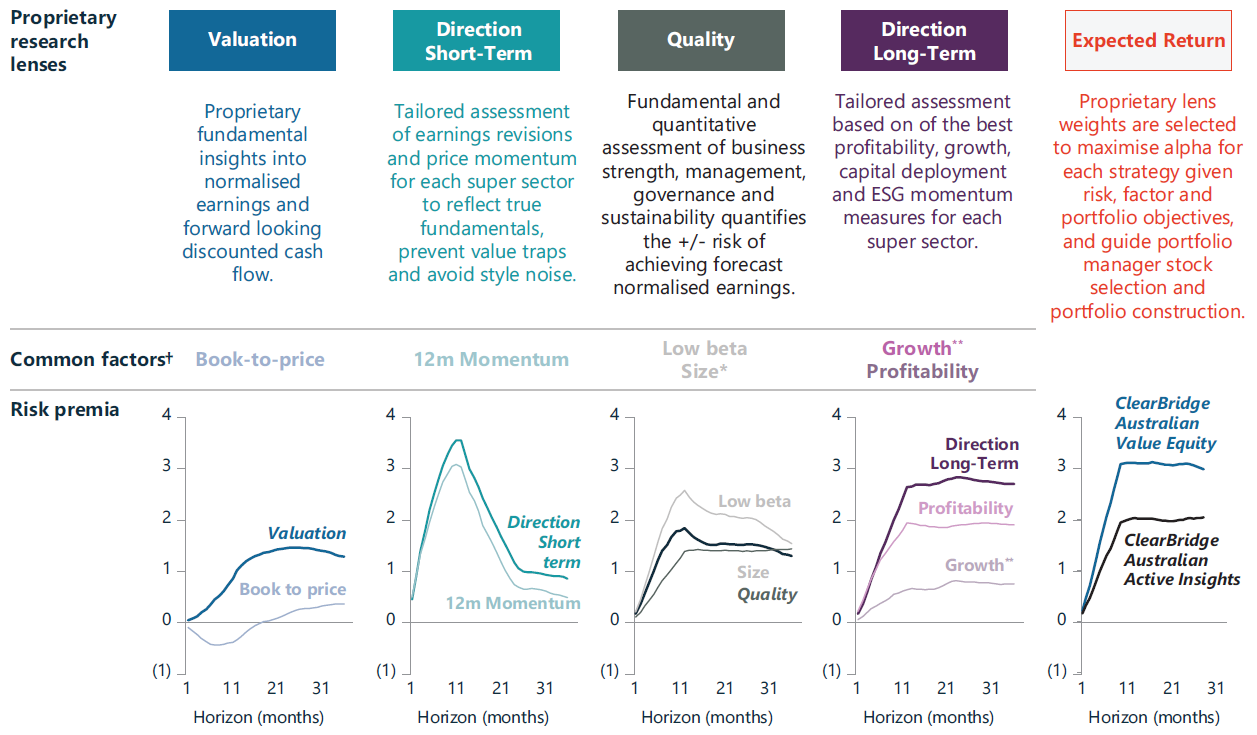
Source: ClearBridge, FactSet; as of 31 December 2024. Time series data shown for illustrative purposes only. Depicts investment horizons up to 3 years. Periods over a year are annualised. Sample Period: 31 March 2011 to 31 December 2023. Data is relative to the S&P/ASX 200 Accumulation Index. Please refer to endnote for details on methodology2. Past performance is not a guide to future returns. These numbers do not represent the performance of an actual portfolio and should not be considered as an indication of future returns.
Re-engineering Our Approach to Core Solutions
Our firm has been managing core equity solutions continuously since 1988. The portfolio construction process has evolved through time keeping pace with the evolution in academic research and best practice active management. In December 2021, we implemented several significant changes to our process to better design a core equity strategy that can withstand large dislocations as well as better isolate and harness fundamental insights from style in a risk-controlled way. These key changes were:
- Dissection of our Direction lens into two separate lenses as outlined above, Direction Short-term and Direction Long-term;
- Introduction of a continuous weighting scheme to determine stock conviction based on each stock’s ranking versus the universe for each proprietary lens using weightings derived from our historical research inputs; and
- Replacing an external third-party model with a proprietary risk model which allows us to neutralise factor and sector influences dynamically.
The process enhancements aimed to provide lower factor and sector risks, ensure that over- and under-weights are proportional and ensure that the impact of our underweight positions are more constrained in their impact on performance. With these enhancements, the solution became known as ClearBridge Australian Active Insights.
How We Isolate True Pure Alpha from Style Factors
ClearBridge Australian Active Insights aims to provide investors with an efficient portfolio delivering a consistently reliable alpha stream over shorter investment horizons coupled with a lower tracking error.
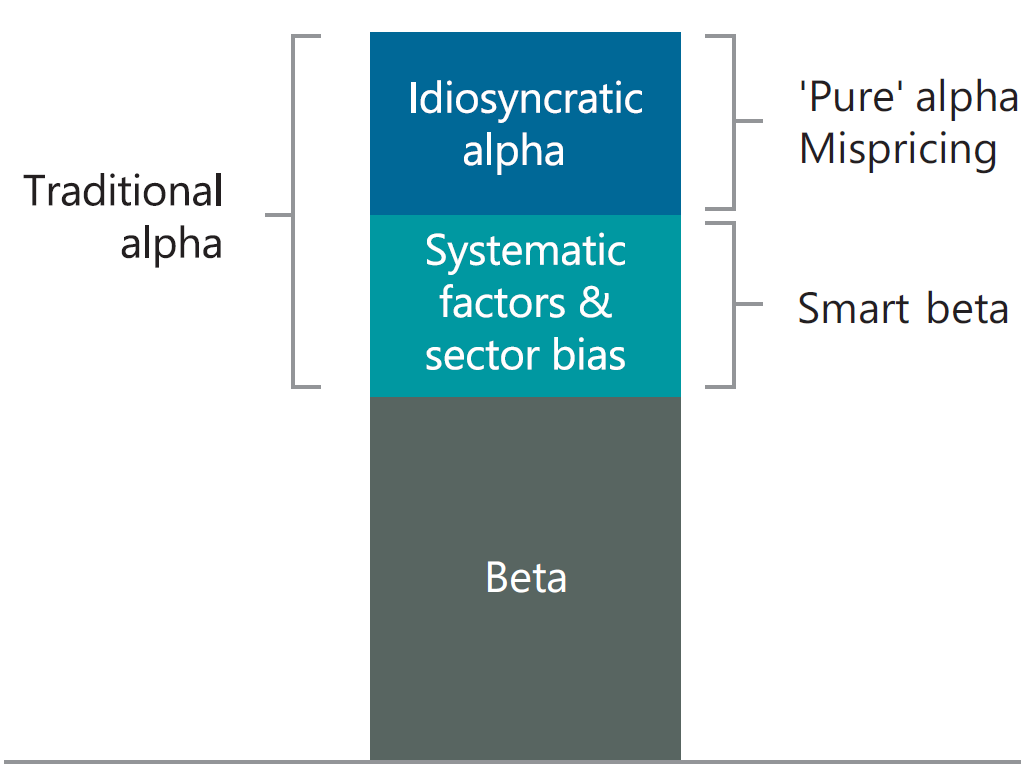
Our analysts maintain full coverage of each S&P/ASX 200 constituent, and we use their estimates and qualitative assessments to build style-neutralised expected returns for each stock. We undertake a proprietary multi-factor regression of the analysts’ raw risk-adjusted expected returns against common style factors such as book-to-price, price momentum, beta, size and growth. We also address any imbalances that may arise through exposures to the four super sectors of the benchmark - industrials, financials, real assets and resources. The final step amalgamates regression-based adjustments for each stock’s expected returns to create a style-neutral measure we call Mispricing. This Mispricing measure isolates and captures our analyst’s ‘pure’ fundamental insights, without systematic factor risks and super-sector biases.
In Exhibit 4, a simple two-dimensional representation of a more complex multi-lensed approach, you can see that stock X and Y have a similar expected return, but stock X has more Mispricing after common style factor (and super-sector) exposures are neutralised.
Exhibit 4: Mispricing Model
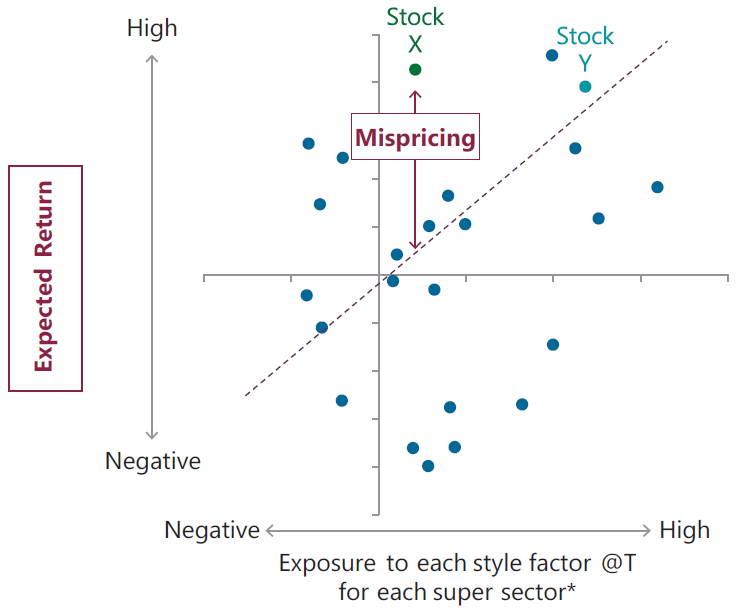
*The x-axis is multi-dimensional and is shown here in the single dimension for illustration purpose here. Source: ClearBridge; data shown for illustrative purposes only. Past performance is not a guide to future returns.
Throughout this process we are seeking to leave the task of the research analyst unchanged – their expertise and insight is still driving the discounted cash flow forecasts we use in calculating expected return. However, by transforming these fundamental expected returns into Mispricing, we are seeking to isolate the truly idiosyncratic insight that ‘survives’ after systematic factor risks and super-sector biases are considered (Exhibit 5).
Exhibit 5: Our Approach
Source: ClearBridge; data shown for illustrative purposes only.
Culminating in More Consistent Alpha with Low Downside Tracking Error
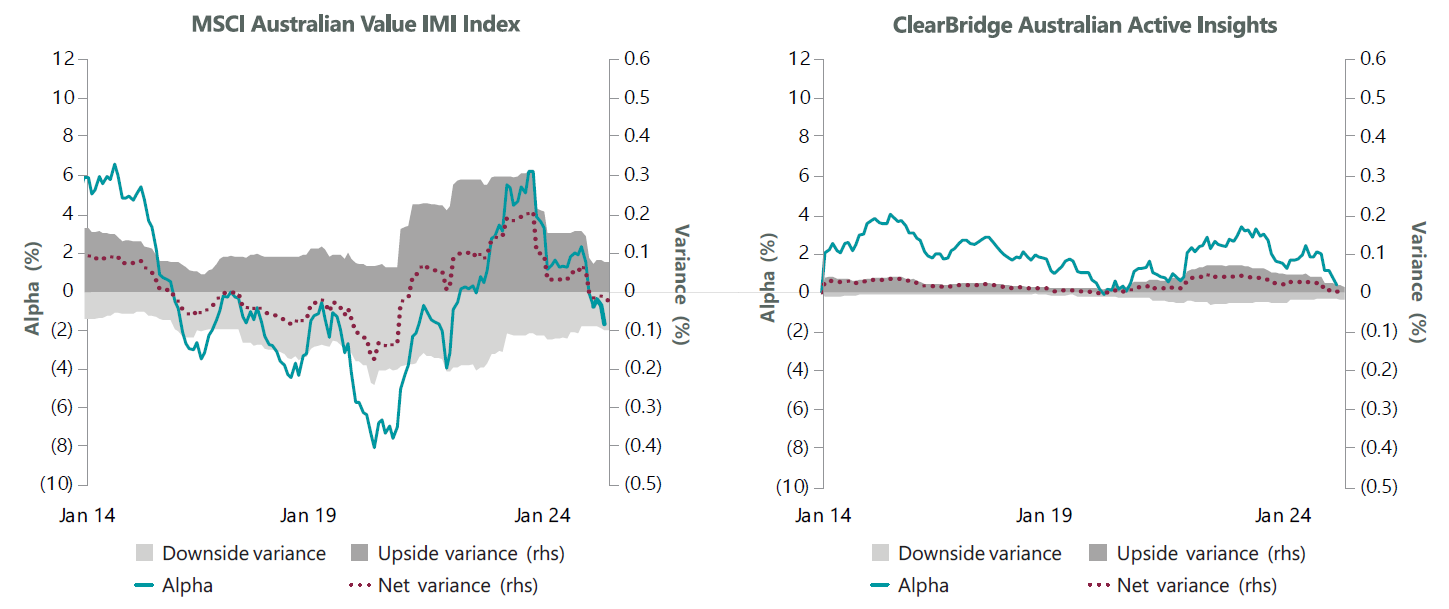
Alpha generated from this approach can be more stable as the returns are less susceptible to typical style cycles. The variability of the MSCI Australia Value Index illustrates this point. The left-hand chart in Exhibit 6 shows the rolling three-year alpha and tracking error of the MSCI Australia Value IMI Index. Through time, the Value style return premium gyrates quite dramatically.
The lower style factor influence of ClearBridge Australian Active Insights can reduce the risk of extended periods of underperformance that could exceed the time horizon and relative risk tolerances of risk-constrained investors. The efficacy of our portfolio construction process in dampening this variability is illustrated in the right-hand chart of Exhibit 6, where the strategy has been able to limit the impact of destructive downside variance on portfolio returns while also benefitting from the ‘pure’ fundamental insight of our experienced team of analysts.
Exhibit 6: Rolling 3-Year Alpha & Upside/Downside Variance
Source: ClearBridge, MSCI; as of 30 June 2025. Data shown for a representative ClearBridge Australian Active Insights account and back test. Index: S&P/ ASX 300 Accumulation. Data shown for illustrative purposes only. Back test sample period from 31 March 2011. Actual returns shown from 1 December 2021. Gross performance data is presented without deducting investment advisory fees, broker commissions, or other expenses that reduce the return to investors. Theoretical results are shown without transaction costs that would reduce the return to investors. Past performance is not a guide to future returns. These numbers do not represent the performance of an actual portfolio and should not be considered as an indication of future returns.
Case Studies - The Portfolio in Practice
Case Study 1: Controlling Top-20 Factor Risk for Smoother Alpha
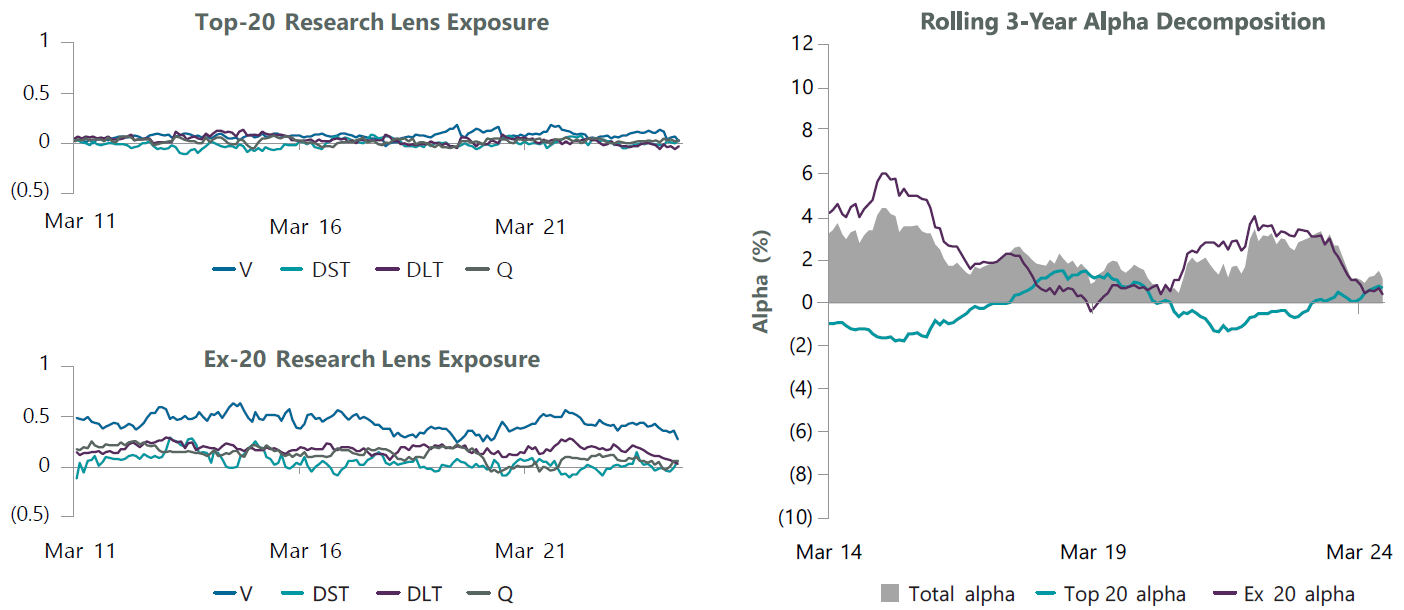
The multi-factor regression process used to minimise style factor and sector risks can also be customised to build portfolios that suit client specific risk budgets or factor exposure gaps (such as between Top-20 and Ex-20 S&P/ASX stocks).
With increasing concentrations of index-sensitive flows into the largest stocks, the size of the passive flows creates capacity issues for smaller stocks, whilst the larger stocks increase in size. Whilst the investment thesis of underweighting size and banks is well understood, asset owners have been left questioning whether there are any alpha opportunities in the Top-20 to exploit. A strategy investors are considering is to take a passive approach to the Top-20 whilst using active management for the Ex-20.
However, we believe active management of the Top-20 is extremely valuable, and our research has found that splitting these out into two sub-portfolios could be counterproductive. Active management in the Top-20 has two important and connected roles in both our style-neutral and style-biased portfolios, and our ClearBridge Australian Active Insights strategy will typically hold each of the Top-20 stocks among our 60 or so portfolio holdings.
- In the short-term, we will typically hold the Top-20 stocks with the greatest risk-adjusted expected alpha as overweights to contribute to alpha, especially as “news” becomes evident.
- The remainder have a role as underweights to balance out residual factor and sector exposures to help provide the more stable, consistent alpha.
This stability then provides the balance and consistency to ‘stay the course’, and act as a funding source so that the outcomes of our pure fundamental research insights within both Top-20 and Ex-20 stocks can play out over the medium to long-term. We also found that an integrated portfolio approach offers the advantage of reducing turnover and improving alpha when stocks moved in and out of the Top-20.
As illustrated in Exhibit 7 from a client solution that was recently implemented, we can use our approach to provide a style neutral exposure to the Top-20 with stable alpha, and residual factor exposures to the Ex-20 where alpha opportunities are more prevalent. In our analysis, we find that the integrated portfolio approach leads to 20% lower turnover than a stand-alone passive Top-20 / active Ex-20 combination and the resultant portfolio is less capacity-constrained.
Exhibit 7: Tailored Portfolio
Source: ClearBridge; as of 31 August 2024. Data shown for a tailored Active Insights back test. Index: S&P/ASX 200 Accumulation. Data shown for illustrative purposes only. Back test sample period from 31 March 2011. Gross performance data is presented without deducting investment advisory fees, broker commissions, or other expenses that reduce the return to investors. Theoretical results are shown without transaction costs that would reduce the return to investors. Past performance is not a guide to future returns. These numbers do not represent the performance of an actual portfolio and should not be considered as an indication of future returns.
Case Study 2: Blending Value and Style-Neutral Portfolios Based on Value Opportunity
Not all the variability of the Value style premium in Australia is “bad”. As the earlier charts show, the Value Index has delivered episodes of rolling-three-year alpha greater than 6% per annum twice in the last decade. Investors wishing to retain the flexibility to maintain some portfolio exposure to benefit from the rewarding episodes of strong positive Value-style have engaged us to assist them in dynamically adjusting their portfolios when Value’s underperformance is driven by valuation extremes rather than deteriorating fundamentals.
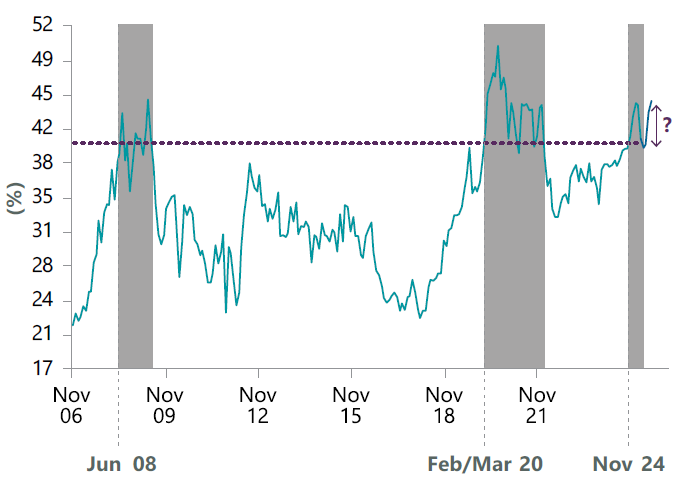
Exhibit 8 plots our proprietary Valuation Spread. This is based on our analysts’ long-term discounted cash flow forecasts and their fundamental qualitative assessments of companies. Recently, it has retraced extremes last seen during the GFC and Covid crisis.
We use our proprietary Valuation Spread to customise an integrated ClearBridge Australian Dynamic Value portfolio comprising sleeves of the ClearBridge Australian Value Equity and the style-neutral ClearBridge Australian Active Insights strategies based on the investors’ specific risk requirements. When there is a higher opportunity for Value to outperform, the portfolio can quickly reallocate towards the ClearBridge Australian Value Equity strategy sleeve.
Conversely, when the Value opportunity is lower, the portfolio tilts towards our risk-managed ClearBridge Australian Active Insights strategy to capture more consistent alpha, with lower tracking error, lower turnover, and less capacity constraints, irrespective of the style environment.
Exhibit 8: Valuation Spread (relative)*
Source: ClearBridge, FactSet; as of 30 June 2025. Data shown for a representative ClearBridge Australian Value Equity representative account. Index: S&P/ASX 200 Accumulation. *Based on our proprietary Valuation of the ClearBridge Australian Value Equity representative account vs. our Proprietary Valuation of the S&P/ASX 200 (log). Past performance is not a guide to future returns.
Leaning Into Fundamental Active Management with Confidence
The forward P/E ratio of the S&P ASX/200 Index reached 19x at the end of June 2025, almost two standard deviations above its long-term average of 14.8x3. History reinforces that high valuations and heightened concentration can lead to lower future expected returns and increased risks. We believe active management will play a critical role in ensuring beneficiaries enjoy stronger investment outcomes over the coming years.
Through dynamic neutralisation of style-factor and super-sector exposures, our ClearBridge Active Insights strategy have been successfully capturing the consistent alpha sourced from our team’s ‘pure’ fundamental insight whilst limiting the impact of downside variance since the process enhancements in December 2021.
As a core, factor neutral exposure, the strategy’s unique source of ‘pure’ insight yields a coherent and effective portfolio that complements exposures to common style factors such as value, momentum and quality that may be prevalent elsewhere in a client’s portfolio. Furthermore, our approach typically derives most of its alpha from outside the Top-20 stocks and can be readily adapted to meet client preferences for variable exposure to the Value-style.
Related Perspectives

2026 Australian Equity Outlook
Explore the dynamic landscape that Australian Equities experienced over 2025, prospects for the market, and ClearBridge Australian Active Equity and Equity Income portfolios in 2026.
Read full articleDisclaimer
1 Brightman, C. & Harvey, C. 2025. “Passive Aggressive: The Risks of Passive Investing Dominance”. Available at SSRN.
2 Gross performance data is presented without deducting investment advisory fees, broker commissions, or other expenses that reduce the return to investors. Theoretical results are shown without transaction costs that would reduce the return to investors. †Common factors reflect those identified in academic research such as Fama-French (1992), Jegadeesh-Titman (1993), Titman (2004), Ang (2006); Frazzini (2014) and Novy-Marx (2013). ^Risk premia: denotes the average return associated with a one standard deviation change for an proprietary research lens’ signal score or Fama-French or other factorscore. Positive and larger risk premia indicate better efficacy. *Size depicts a premium for large-cap stocks over small cap stocks. **Growth represents a composite factor, incorporating discrete Capital Deployment measures for each proprietary super-sector.
3 Source: ClearBridge, FactSet; as of 30 June 2025.
Important Information
Franklin Templeton Australia Limited (ABN 76 004 835 849) is part of Franklin Resources, Inc., and holds an Australian Financial Services Licence (AFSL No. 240827) issued pursuant to the Corporations Act 2001. The ClearBridge Australian equities investment team, a division of Franklin Templeton Australia Limited, is operationally integrated under the “ClearBridge Investments” global brand, alongside ClearBridge Investments, LLC (“CBI”), and other ClearBridge entities indirectly wholly owned by Franklin Resources, Inc. Distribution of this material is issued and approved in Australia by Franklin Templeton Australia Limited.
This publication is issued for information purposes only and does not constitute investment or financial product advice. It expresses no views as to the suitability of the services or other matters described in this document as to the individual circumstances, objectives, financial situation, or needs of any recipient. You should assess whether the information is appropriate for you and consider obtaining independent taxation, legal, financial or other professional advice before making an investment decision.
Neither ClearBridge Investments, Franklin Templeton Australia, nor any other company within the Franklin Templeton group guarantees the performance of any Fund, nor do they provide any guarantee in respect of the repayment of your capital.
The document does not form the basis of, nor should it be relied upon in connection with, any subsequent contract or agreement. It does not constitute, and may not be used for the purpose of, an offer or invitation to subscribe for or otherwise acquire shares in any of the products mentioned.
Past performance is not a guide to future returns.
The distribution of specific products is restricted in certain jurisdictions, investors should be aware of these restrictions before requesting further specific information.
The views expressed are opinions of the portfolio managers as of the date of this document and are subject to change based on market and other conditions and may differ from other portfolio managers or of the firm as a whole. These opinions are not intended to be a forecast of future events, research, a guarantee of future results or investment advice.
Some of the information provided in this document has been compiled using data from a representative account. This account has been chosen on the basis it is an existing account managed by the investment team , within the strategy referred to in this document. Representative accounts for each strategy have been chosen on the basis that they are the longest running account for the strategy. This data has been provided as an illustration only, the figures should not be relied upon as an indication of future performance. The data provided for this account may be different to other accounts following the same strategy. The information should not be considered as comprehensive and additional information and disclosure should be sought.
The information provided should not be considered a recommendation to purchase or sell any particular strategy / fund / security. It should not be assumed that any of the securities discussed here were or will prove to be profitable. It is not known whether the stocks mentioned will feature in any future portfolios managed by the investment team. Any stock examples will represent a small part of a portfolio and are used purely to demonstrate our investment style.
Risk warnings – Investors should also be aware of the following risk factors which may be applicable to the strategy shown in this document.
- Investing in foreign markets introduces a risk where adverse movements in currency exchange rates could result in a decrease in the value of your investment.
- This strategy may hold a limited number of investments. If one of these investments falls in value this can have a greater impact on the strategy’s value than if it held a larger number of investments.
- Smaller companies may be riskier and their shares may be less liquid than larger companies, meaning that their share price may be more volatile.
- The strategies mentioned may invest in derivatives (index futures) to obtain, increase or reduce exposure to underlying assets. The use of derivatives may restrict potential gains and may result in greater fluctuations of returns for the portfolio. Certain types of derivatives may become difficult to purchase or sell in such market conditions.
Risk warnings – Investors should also be aware of the following back-test risks.
- The back-test results presented in this document are based on simulated performance results. Please be aware these have certain limitations.
- Back-tested performance returns do not represent the impact of trading. The trades in the back testing have not been executed and may not fully reflect the impact of market factors such as liquidity.
- The investment team makes no representation that any account will or is likely to achieve returns similar to those illustrated as a result of the back testing presented.
© Copyright Franklin Templeton Australia Limited.
You may only reproduce, circulate and use this document (or any part of it) with the consent of Franklin Templeton Australia Limited.

