Although markets often pause to digest after large gains, history suggests these episodes usually prove fleeting, meaning major indexes could move higher in the second half of 2026.
Anatomy of a Recession
AOR Update: The Anti-Taper Tantrum
Key Takeaways
- With the economy recovering, gradually removing quantitative easing is a step toward returning to a more normal but still accommodative monetary policy stance before the Federal Reserve eventually shifts to more constrictive policy by hiking interest rates.
- While the Fed believes the high level of inflation is largely driven by pandemic-related forces, suggesting price pressures will moderate as the pandemic ebbs, we believe long-term investors should be most focused on how far inflation may cool.
- As we await more information on the Omicron variant, two indicators on the ClearBridge Recession Risk Dashboard will be key in monitoring the effects of the Fed taper on financial conditions: Money Supply and the Yield Curve.
Inflation Causes Fed to Struggle in Balancing Dual Mandates
Last month the Federal Reserve unveiled its strategy to slow the pace of quantitative easing (QE) purchases of Treasury and mortgage-backed securities, a process known as tapering. This program was put in place as the pandemic unfolded to support economic growth by keeping interest rates low, spurred investment and spending by reducing the cost of capital. QE has been used by the Fed in recent years (and by other central banks previously) with its primary policy tool (the Fed Funds rate) constrained by the zero lower bound. When interest rates have already been lowered to zero, QE is the next tool the Fed implements. With the economy now recovering, removing QE is a step toward returning to normal before the Fed eventually hikes interest rates.
The timing of the Fed’s taper has been widely debated over the past several months. Its dual mandate is for stable prices and maximum employment. On the latter front, the total number of workers employed in the U.S. is 4.2 million below the pre-pandemic peak. However, steady progress continues to be made as evidenced by October’s 531,000 payroll gain along with substantial positive revisions to earlier months. When considering where the labor market “could have been” absent the pandemic, i.e. assuming further growth along the pre-pandemic trend, the shortfall in workers – known as an output gap – is an even larger 8.2 million. This is one of the primary considerations the Fed has in thinking about policy re-normalisation and may explain why it has been so patient so far.
Exhibit 1: Labor Output Gap
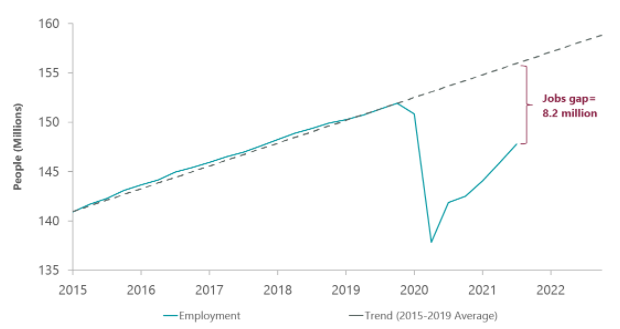
Data as of Sept. 30, 2021. Source: Bureau of Labor Statistics, Bloomberg.
The other part of the dual mandate is for stable prices, which has been a focal point for investors and market observers in recent months. The Consumer Price Index came in at 6.2% on a year-over-year basis for October, the highest reading in 30 years. Core personal consumption expenditures – the Fed’s preferred inflation measure – is a tamer 4.1% but also at its highest level in 30 years. This level is likely well above what could be considered tolerable under the flexible average inflation targeting framework. However, the Fed continues to believe the high level of inflation is largely driven by pandemic-related forces, suggesting inflation will moderate as the pandemic ebbs. In our view, long-term investors should be most focused on just how much inflation cools. Many components of inflation that are less-influenced by the pandemic have grinded higher in recent months, albeit to levels that suggest inflation in the mid-2% range. As a result, one of the key debates in financial markets is where inflation will end up in the second half of 2022, 2023, and beyond. The prevailing view is that inflation will remain elevated if not rise further in the coming months before eventually cooling. Financial markets currently subscribe to this view, with breakeven rates – the amount of
inflation needed for Treasuries and TIPS to deliver an equivalent yield – suggesting a moderation of inflation in the coming year.
Exhibit 2: Longer Term Inflation Not a Concern
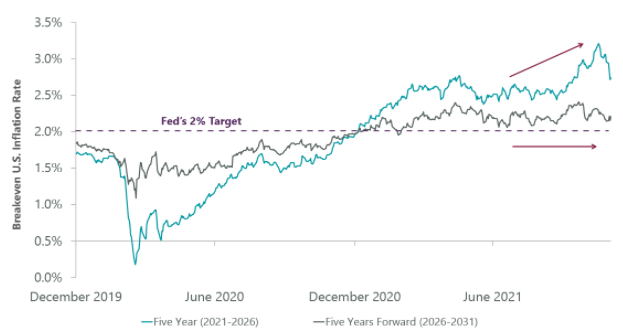
Five year period represents period from Dec. 2021 – Dec. 2026; five years forward represents period from Dec. 2026 – Dec. 2031. Data as of Dec. 2, 2021. Source: FactSet.
Importantly, the Fed has stressed that policy is not on auto-pilot and that it could speed up or slow down the pace of the taper if inflation or economic conditions warrant doing so. In a shift, Powell recently suggested that it may be appropriate for the Fed to consider accelerating the pace of QE tapering in December, despite the unknowns associated with the Omicron variant. This caught some investors off guard (ourselves included), as the initial response of many to Omicron was that it would likely lessen the chances of the Fed accelerating the pace of the taper, given the unknown risks to the economy.
While it’s a reasonable possibility that this variant may prove to be more bark than bite, the perception that the Fed may not have investors backs to the same degree as in the recent past caused a bout of volatility. This is understandable when considering the combined risks of a more hawkish Fed and Omicron, but also suggests that risk assets could rebound if the overhang from the new variant clears. While we await more information on the variant, two indicators on the ClearBridge Recession Risk Dashboard will be most important in monitoring the effects of the Fed taper on financial conditions: Money Supply and the Yield Curve. At present, both are in green expansionary territory but have become “less green” beneath the surface than they were several months ago. That being said, there are no changes to the dashboard this month.
Exhibit 3: ClearBridge Recession Risk Dashboard
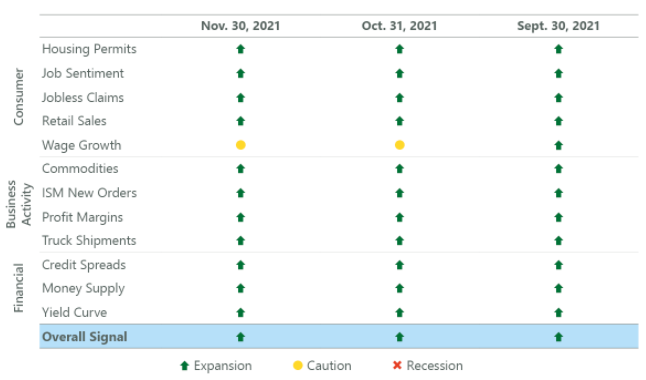
Source: ClearBridge Investments.
Taking a step back, policymakers deserve credit for engineering one of the most rapid recoveries from one of the deepest recessions on record. No policy response is perfect, but in March 2020 it would have been hard to imagine that capital markets would have more than doubled from the lows in just 18 months. With the labor market improving and inflation overshooting, the Fed has determined the time has come for policy re-normalisation. Importantly, the Atlanta Fed’s nowcasting model (GDPNow), designed to assess U.S. real intra-quarter GDP growth, is currently estimating 4Q GDP to be 9.7%. Although the tightening process has officially begun, tapering is akin to taking your foot off the accelerator rather than slamming on the brakes which is the goal of rate hikes. The Fed remains extremely accommodative from a historic perspective given the strong economic backdrop. Assuming the worst-case scenario is avoided, a variant that makes vaccines ineffective, we believe any selloff should be a great entry point for investors as we enter the middle stages of this new economic expansion.

Jeffrey Schulze, CFA
Related Perspectives
Anatomy of a Recession
