History shows that investors should take advantage of the opportunity that appears to be emerging, with solid returns in the S&P 500 following historical “geopolitical dips.”
Anatomy of a Recession
AOR Update: New Year, Same Rotation
Key Takeaways
- Market leadership continued to broaden in January with value, small caps and non-U.S. equities gaining momentum, a trend we think will continue in 2026 on the back of broadening earnings delivery.
- The ClearBridge U.S. Recession Dashboard continues to show a solid overall expansionary green signal, with the ISM New Orders signal improving in January. We believe the economy will remain robust in the first half of 2026 helped by OBBB tax-refund fiscal tailwinds.
- Elevated market concentration presents an opportunity for active stock pickers who can sidestep concentration risks embedded into benchmarks. Historically, non-U.S. stocks have fared well in the years following periods of elevated U.S. market concentration.
The new year picked up where the last left off, with equity market leadership in January undergoing a rotation. The Russell 1000 Value Index outpaced the Russell 1000 Growth Index by six percentage points in price terms, while the small cap Russell 2000 Index returned roughly four percentage points more than the large cap Russell 1000 Index. Bloomberg’s Magnificent 7 Price Return Index was up just 0.6% for the month, another sign that our long-standing call for a broadening of market leadership continues to play out.
This view has been predicated on an improvement in corporate profits, with broader earnings delivery being the key catalyst for a sustained move. Our research shows that, over the long run, earnings drive the majority of stock returns. At the index level, earnings are closely linked to economic cycles, which is in part why the ClearBridge U.S. Recession Dashboard remains our compass when forming a view on both the U.S. economy and financial markets.
To be clear, the adage that “the stock market is not the economy” remains true and to that end the dashboard is not the end of our analysis, but rather the beginning. At present, the dashboard continues to show a solid overall expansionary green signal. There is one positive signal change this month: ISM New Orders improved to green on the back of a blowout print, which signals a potential manufacturing rebound in the coming months (Exhibit 1).
Exhibit 1: U.S. Recession Dashboard
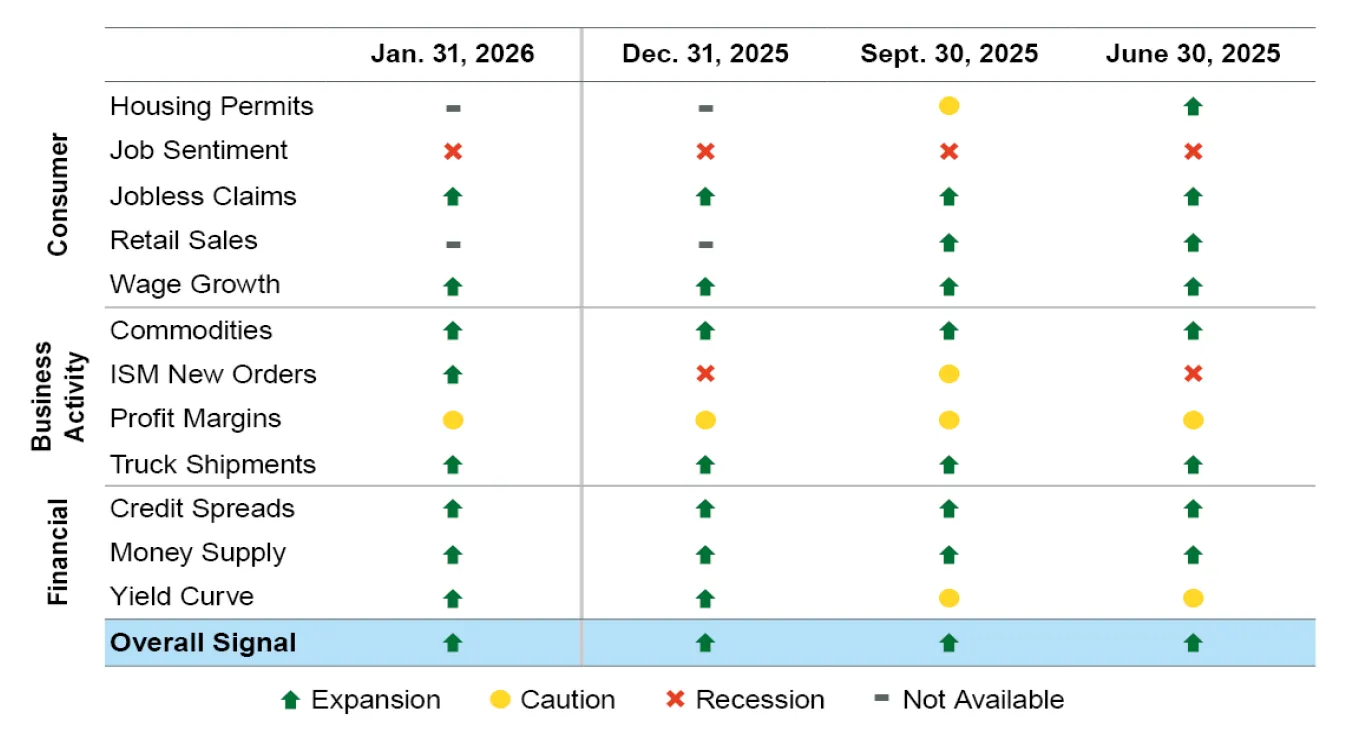
Data as of Jan. 31, 2026. Source: ClearBridge Investments.
Several key technology companies have reported stellar fourth-quarter and full-year 2025 results, including Apple, Meta Platforms and Microsoft. With earnings season approaching the half-way mark, and despite mixed guidance and stock reactions — notably among mega caps — technology is once again looking like a standout with EPS growth expected to come in more than double the benchmark’s rate. However, this earnings advantage is expected to narrow in 2026, with SMID caps and the “S&P 493” — the 493 non-Magnificent Seven names in the S&P 500 — poised to continue to close the EPS growth gap, according to sell-side analysts (Exhibit 2).
Exhibit 2: Closing the Gap
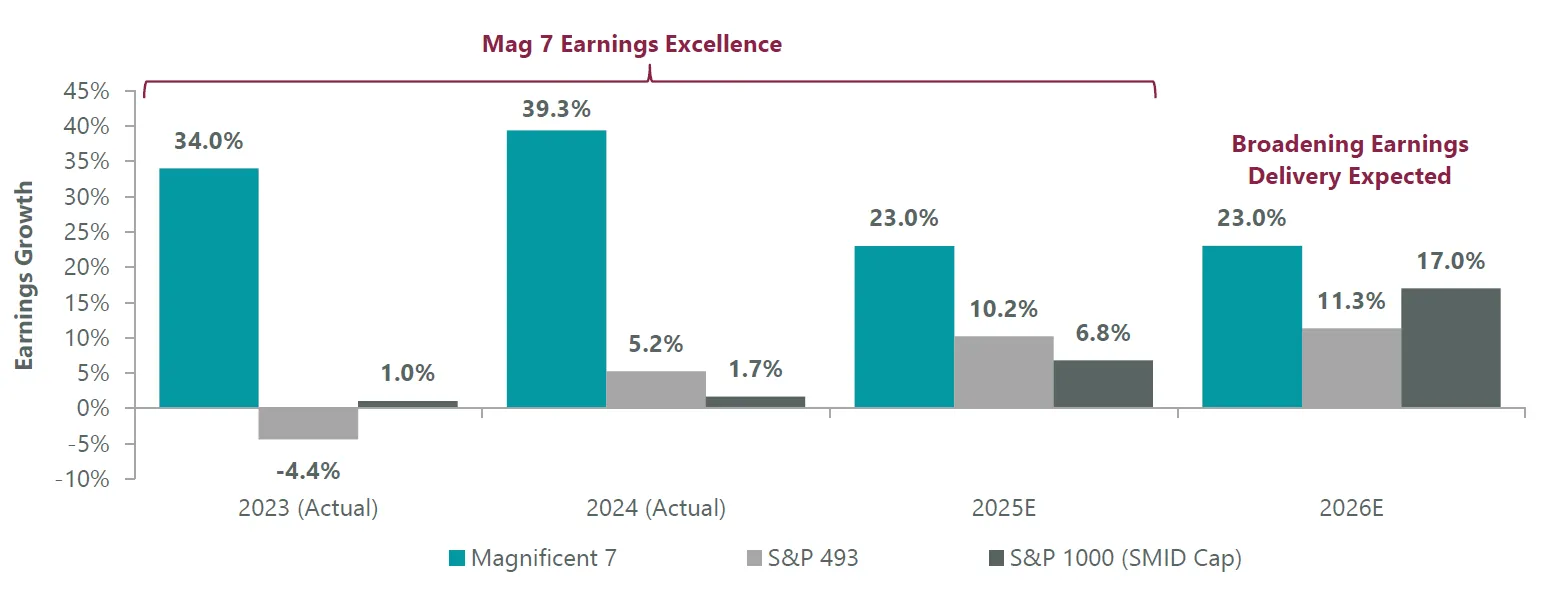
The term “consensus” within the capital markets industry refers to the average of earnings estimates made by professionals. Magnificent 7 data refers to the following set of stocks: Microsoft (MSFT), Amazon (AMZN), Meta (META), Apple (AAPL), Google parent Alphabet (GOOGL), Nvidia (NVDA), and Tesla (TSLA). Data as of Jan. 31, 2026. Sources: FactSet, S&P.
This narrowing earnings advantage for the largest names in the benchmark is an important dynamic that began late last year and, in our view, helped spark the aforementioned leadership rotation. Looking ahead, we believe this dynamic will continue, powered in the near term by fiscal support from the One Big Beautiful Bill. Over the next few months, middle- and upper-middle income consumers (with incomes of ~$50k-$150k) will see the largest increase in their tax refunds relative to their incomes, which should help power spending in the real economy. We believe consumer-facing areas like restaurants, retail and travel could see outsize benefits. Higher-income individuals will also receive large refunds given changing treatment of state and local tax (SALT) deductibility in the Federal code. These individuals tend to save (and invest) a greater share of their tax refunds, however, meaning the market could also see a boost alongside the real economy.
With the S&P 500 achieving new all-time highs in late January and the potential for further upside on the horizon, the power of diversification remains underappreciated in our view. Following the tremendous run growth stocks have had over the past few years, we believe many investors are under-diversified. Over the past two decades, the composition of the S&P 500 has increasingly mirrored the more growth- and technology-oriented NASDAQ tracker QQQ, meaning many “core” allocations now embed a large share of growth within them. As a result, many investors may be inadvertently overexposed to these areas, resulting in portfolio concentration challenges.
Exhibit 3: Not Your Father’s S&P 500
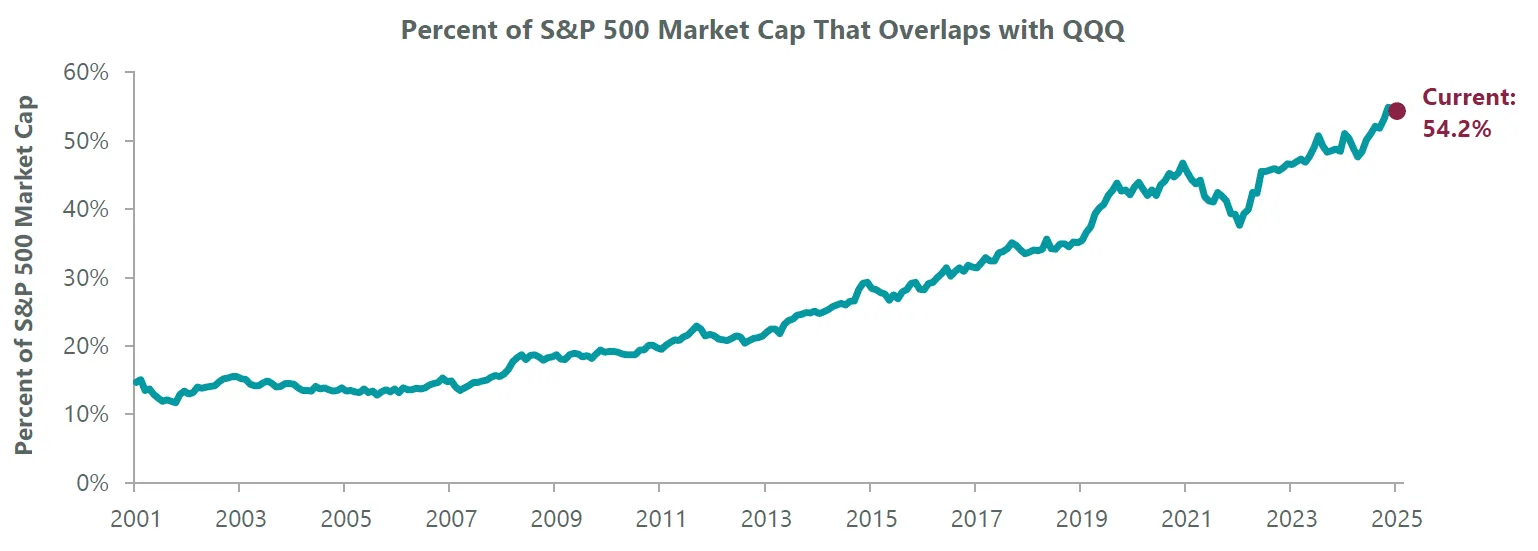
Note: QQQ is an ETF that tracks the Nasdaq 100 index. Data as of Jan. 31, 2026. Sources: S&P, Factset. Market cap is calculated using the sum of constituents.
There are several ways investors can mitigate this issue. One approach is to focus on active management within equities, as these managers have the flexibility to navigate around the concentration risks embedded in passive index strategies. A second approach is to increase allocations to value to ensure portfolio tilts are consistent with strategic and tactical style allocation ranges.
A third tactic is to increase non-U.S. equity exposure. For example, the MSCI ACWI ex-U.S. Index has outpaced the U.S. (S&P 500) by an average of 2.7% annually during the five years following periods of high (over 24%) U.S. market concentration. Concentration is currently elevated, with the top 10 constituents now accounting for 40% of the S&P 500. In fact, this dynamic may already be playing out, with non-U.S. equities following up their strong 2025 run with further outperformance relative to the U.S. in January. Importantly, history shows this dynamic can persist for several additional years.
Exhibit 4: Concentration Leads to non-U.S. Opportunity
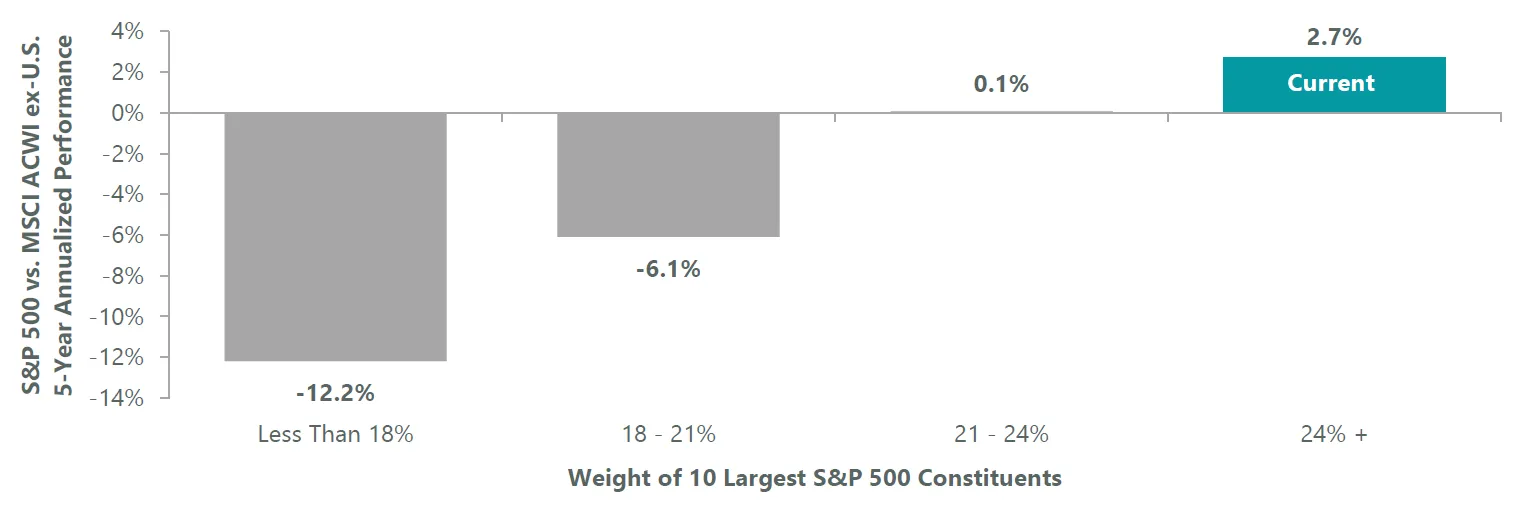
Data shown is from Dec. 1989 – present, as of Jan. 31, 2026. Sources: S&P, FactSet, and Bloomberg.
Speed bumps are almost certain to emerge over the coming 11 months, but we are encouraged by the market’s resilience and participation through the first month of the year. We believe that further continuation of late 2025’s broadening earnings delivery and accompanying market leadership rotation is likely given the underlying fundamental drivers. This stands in contrast to several previous leadership rotation “head fakes” in recent years, where multiples did more of the heavy lifting than earnings in driving stock moves. This has not been the case recently, which we believe is an important distinguisher that will provide additional fuel to power the current move further in the coming months.

Jeffrey Schulze, CFA

Josh Jamner, CFA
Related Perspectives
Anatomy of a Recession
