Although markets often pause to digest after large gains, history suggests these episodes usually prove fleeting, meaning major indexes could move higher in the second half of 2026.
Anatomy of a Recession
AOR Update: Lower Yields, So What?
Key Takeaways
- With the Fed rate hike cycle at or near its conclusion, the 10-year U.S. Treasury yield is likely to stabilise and decline in the coming year, supporting equity market valuations and influencing leadership.
- Bond yields typically track the direction of economic momentum with higher yields accompanying an improving outlook and lower yields signaling deceleration. With a widely followed economic surprise index hitting its top decile earlier this summer, we would not be surprised to see it roll over and bring yields down in the process.
- Equities with defensive and growth characteristics tend to be relative beneficiaries from declining long-term yields, leading us to favor companies with these traits.
Regardless of Macro Outcome, Yields Have Likely Peaked
After embarking upon the most dramatic pace of tightening in two generations, the Federal Reserve may finally be nearing the completion of its hiking cycle. Historically, equities tend to follow a similar pattern in the period leading up to the final rate hike. However, their performance following the last rate hike has a much wider range of outcomes depending on whether the economy falls into a recession or skirts by with a soft landing. Our base case continues to be a recession – a view driven by the continued recessionary red signal from the ClearBridge Recession Risk Dashboard – although the jury is still out on how this story ends. There are no changes to the dashboard this month.
Exhibit 1: ClearBridge Recession Risk Dashboard
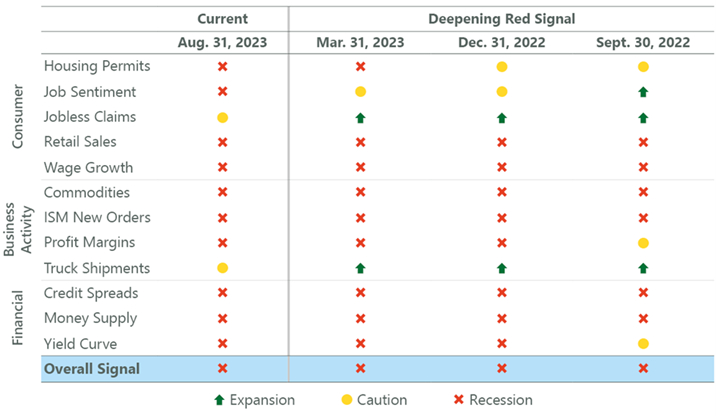
Source: ClearBridge Investments.
Regardless of which path the economy takes, the 10-year Treasury yield has likely already made or is near its peak. The 10-year rose over 100 basis points from its April lows to its recent high in August, with just over half of that occurring between mid-July and late August. History suggests this move may be nearing its end. The 10-year Treasury yield typically peaks around the time of the final rate hike, with a range of four months prior to five months following the peak in the fed-funds rate. If history is a guide, the 10-year is likely to stabilise and decline in the coming year, which would have important ramifications for equity valuations and market leadership.
Exhibit 2: Peak Fed, Peak 10-Year
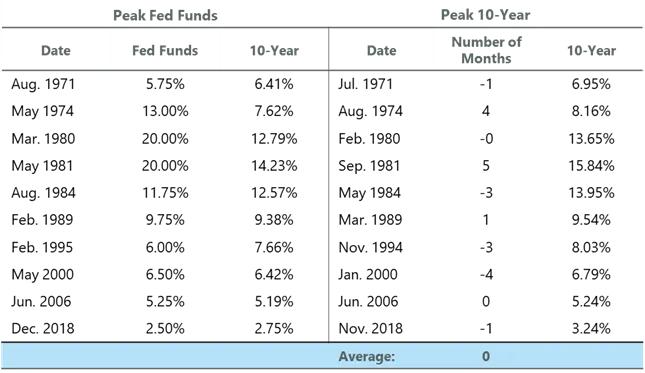
Source: Federal Reserve and Bloomberg.
Declining long-term interest rates bode well for equity market valuations because future cash flows are discounted by a smaller amount. In effect, the value assigned to future profits rises as the discount rate declines, increasing the theoretical value of an asset despite no change in the underlying cash flows. At 18.8x next-12-month earnings, the S&P 500 can hardly be described as “cheap” on a valuation basis. However, if the 10-year Treasury yield – and discount rates by extension – decline from here, the market multiple would look less stretched than it currently does with the 10-year yielding more than 4%.
Beyond the general level of valuations, bond yields can also influence market leadership as evidenced by the market’s recent choppiness. Generally, equities with defensive and growth characteristics tend to be relative beneficiaries from declining long-term yields, while cyclical and value stocks tend to hold up better as rates ascend. As the 10-year rose sharply from late July through late August, sectors like utilities (defensive) and information technology (growth) underperformed while energy (cyclical) and health care (value) outperformed.
This dynamic occurs for several reasons. Firstly, lower bond yields tend to signal decelerating economic momentum. The 10-year Treasury yield closely tracks changes in the Bloomberg Economic Surprise Index, which measures the frequency with which data releases are beating (positive) or missing (negative) expectations. Lower yields tend to be associated with slower economic growth, meaning equity investors tend to seek out companies with more resilient earnings profiles and attractive dividend yields, like defensives. By contrast, higher yields tend to accompany an improving economic outlook, which typically boosts the cash flows of cyclical companies to a greater degree. At the same time, investors can find more attractive yields in fixed income, further diminishing the appeal of defensives relative to cyclicals. With the Economic Surprise Index hitting its top decile earlier this quarter, we would not be surprised to see it roll over, bringing 10-year yields lower in the process.
Exhibit 3: Bond Yields Move with Economic Momentum
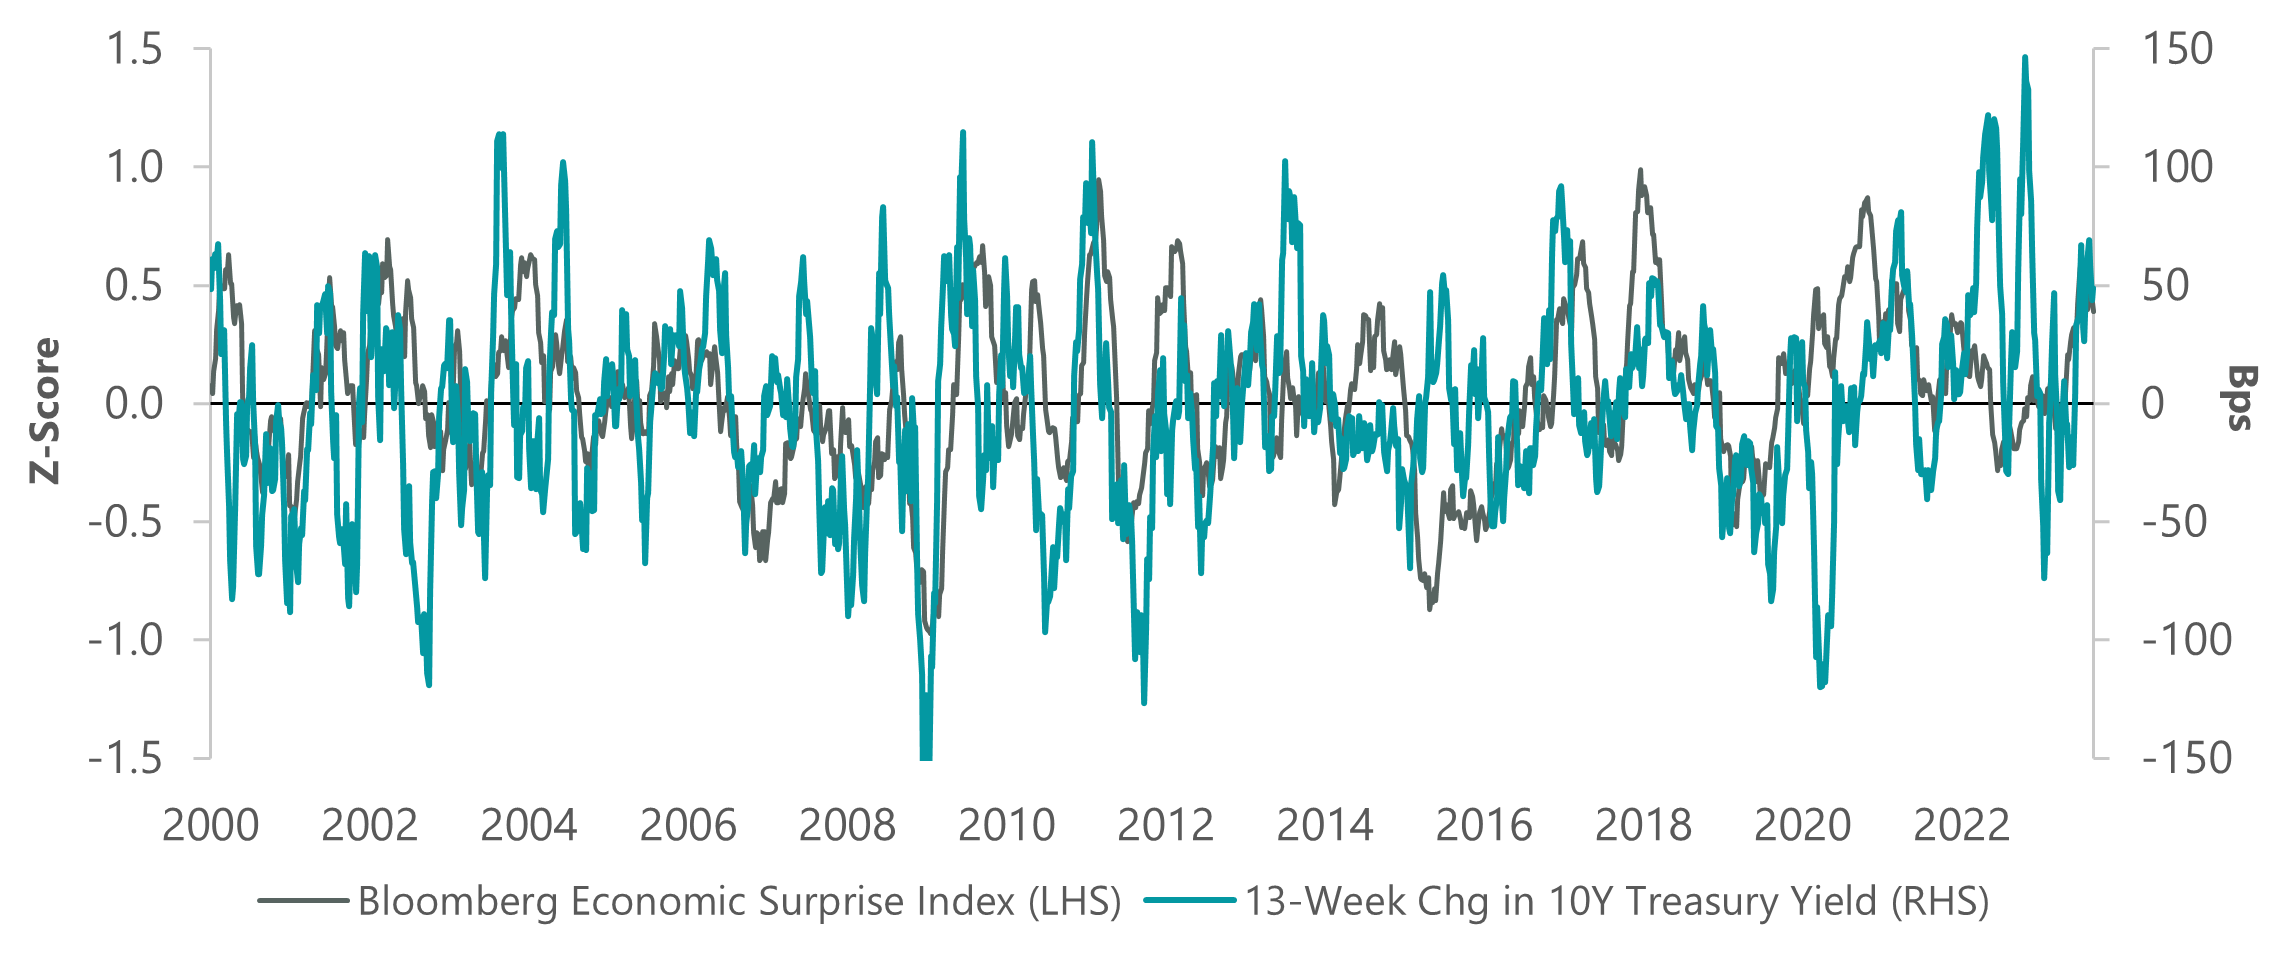
Data as of 1 September 2023. Source: Federal Reserve and Bloomberg.
A second way interest rates impact equity leadership is related to the discount rate dynamic outlined above. Growth stocks tend to have a greater emphasis on cash flows further in the future. As a result, those equities tend to be punished more as the discount rate rises and the value of those future cash flows is reduced. By contrast, value stocks tend to be priced on cash flows occurring in the next few years, making them relatively less susceptible to changes in the discount rate.
Importantly, the S&P 500 has become more dominated by companies with growth and defensive characteristics in recent years, while the share of cyclicals and value has declined. This is hardly a new phenomenon, in fact, this trend has been gaining strength for the last 100 years. Today, the share of the S&P 500 that can be classified as growth, stability and defensive is over 70%, up from 60% ten years ago and 40% almost 100 years ago.
Exhibit 4: Index Composition Supports Higher P/Es
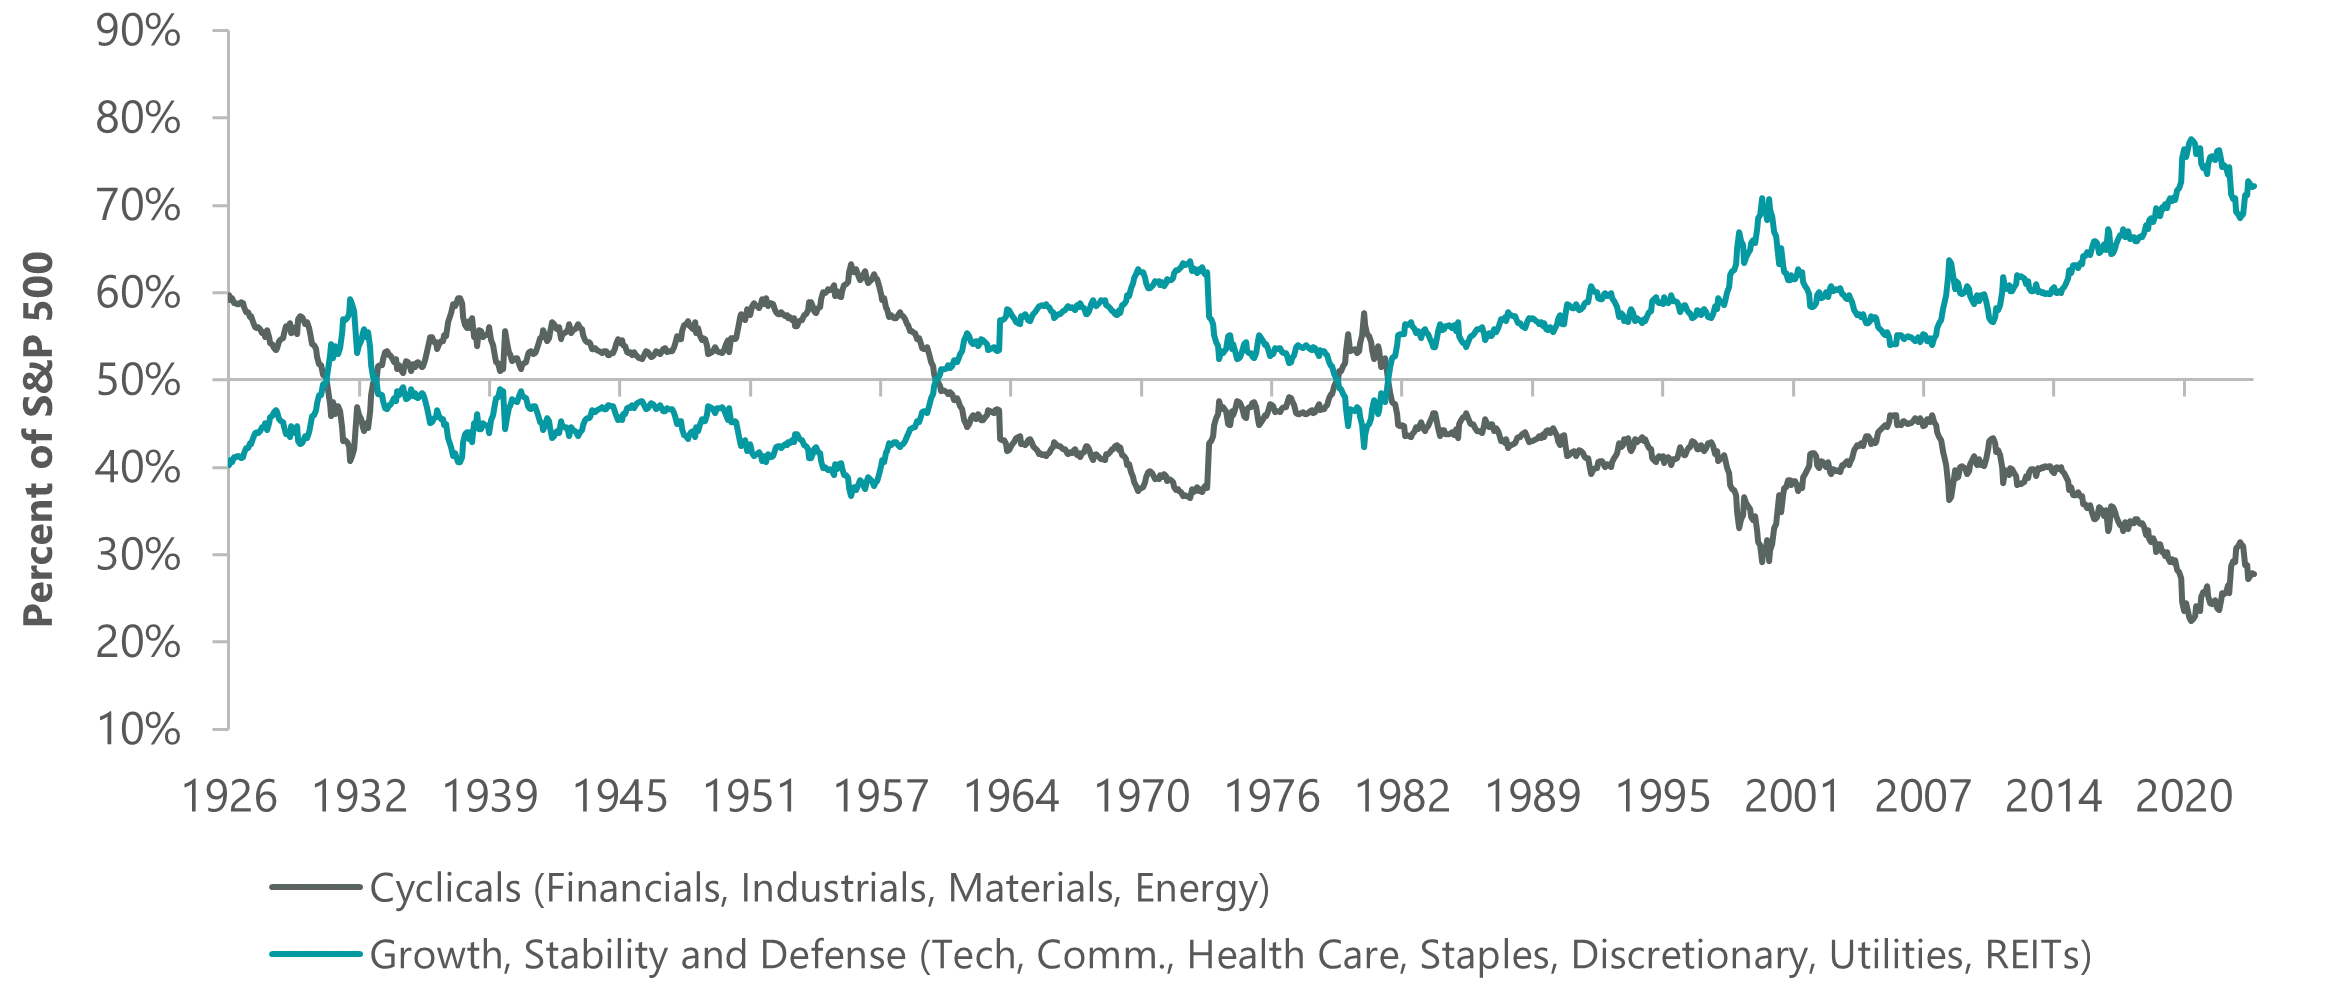
Data as of 31 August 2023. Source: Cornerstone Macro, FactSet, S&P.
This means the benchmark has become more sensitive to changes in bond yields than in the past. If bond yields are nearing or have reached a peak, lower rates could help support valuations in a soft-landing scenario or blunt some of the pain for equities in a recession. Just how much Treasury yields may fall is an open question.
Conceptually, yields can be decomposed into three pieces: inflation expectations, economic growth and the term premium. The term premium is the additional compensation investors require, above and beyond the growth and inflation components, to lend their money for longer periods. Following the Global Financial Crisis, the term premium collapsed and was deeply negative at times with investors flocking to the safety of Treasurys. More recently it has risen, and investors may ultimately decide that additional compensation is required, particularly given the renewed uncertainty around inflation and the large deficits the U.S. government continues to run.
This cycle’s potential rate decline could be more truncated compared to history. Even so, we continue to believe equity leadership should be marked by defensive and growth tilts, with those characteristics being more leveraged to declining bond yields (regardless of magnitude) which we believe are on the horizon.

Jeffrey Schulze, CFA

Josh Jamner, CFA
Related Perspectives
Anatomy of a Recession
