Periods of substantial uncertainty offer an opportunity for individuals and professionals alike to gain an investment edge by lengthening their time horizon.
Anatomy of a Recession
The Long View: 2022 - The Year of Transition
Key Takeaways
- We expect more volatile equity markets with more muted returns than the last two years as the macro environment undergoes a shift in terms of phase of the economic cycle, the pandemic, monetary policy and fiscal stimulus.
- Inflation will likely get worse over the next few months as easy comparisons from a year ago are lapped but should improve later in 2022 when comparisons become more challenging. Despite an unprecedented set of reasons for prices to soar, longer-term inflation expectations remain muted.
- Although the current cycle could run hotter and shorter than past recoveries, the near-term prospects for a recession remain muted. Despite two negative indicator changes, the ClearBridge Recession Risk Dashboard continues to flash an overall green signal.
Maturing of Economy and Market Could Be Bumpy
The investment community’s word of the year for 2020 was undoubtedly “unprecedented” following the deep pandemic-induced recession and the unparalleled policy response that followed. “Transitory” would be our submission for the word of 2021, with central bankers (and us) underestimating the current inflationary impulse. As we look ahead to 2022, “resilience” could be a frontrunner for word of the year, as virus disruptions hopefully become less frequent. However, we believe “transition” may actually best encapsulate 2022, as the macro environment undergoes a shift in terms of phase of the economic cycle, the pandemic, monetary policy, fiscal stimulus, inflation and financial markets. While transitions can sometimes be a little bumpy, they are normal and typically signal a maturing economic and market cycle.
The economic transition from early to mid-cycle is ongoing, with real GDP growth and job creation coming off a boil from 2021 peak levels. Although growth will decline in the coming year, consensus expectations are for a still-robust 3.9% increase in real GDP, a level better than any single year in the decade following the Global Financial Crisis. Currently, the economy is expected to move toward its pre-pandemic trend in 2023, with GDP slowing further to 2.5% and job creation poised to fall toward the 175,000 per month range. While this normalisation is a positive development, the slack created by the recession is being absorbed much faster than usual. For example, the time it took for earnings per share (EPS) to recover to the prior peak this cycle was much shorter compared to the last several recessions. Given that the length of the EPS recovery and the overall economic expansion appear to be related, the current expansion could be shorter than the 8.5-year average seen over the last four cycles.
Exhibit 1: Speedy Recovery, Shorter Expansion
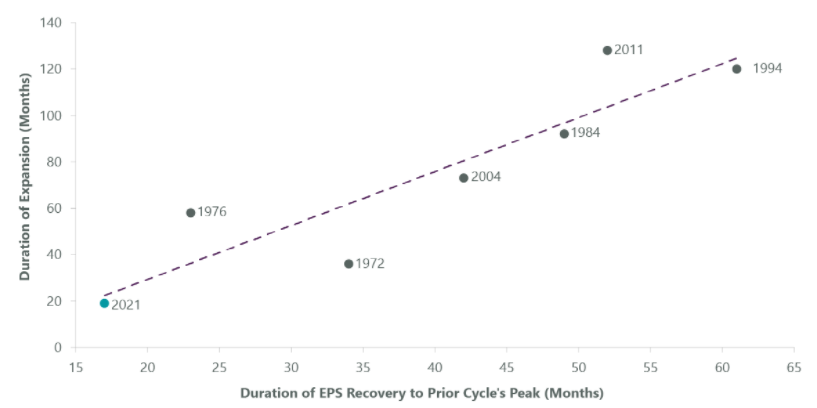
Data as of Nov. 30, 2021, latest available as of Dec. 31, 2021. Source: Bloomberg, National Bureau of Economic Research.
Although the potential for a more truncated and hotter economic cycle exists, near-term prospects for a recession remain muted. At present, the ClearBridge Recession Risk Dashboard continues to flash a robust overall green expansion signal. The dashboard, however, has experienced some minor deterioration this quarter with Wage Growth turning red and Money Supply declining to yellow. While having some color in the dashboard is a departure from recent quarters, recession risks remain low despite the recent outbreak of Omicron. For example, the Atlanta Fed’s GDPNow is currently tracking to 7.4% real GDP for the fourth quarter, much higher than at any point during the third quarter’s Delta-related disruption. Omicron will likely take down the current GDPNow estimate, but while the economy may bend, it shouldn’t break. Furthermore, most recent data suggest Omicron is more contagious but less deadly than previous variants, which could be important as we transition from pandemic to endemic. This shift will not be costless, but it should be positive for risk assets as the necessity for additional social distancing measures and restrictions diminishes.
Exhibit 2: ClearBridge Recession Risk Dashboard
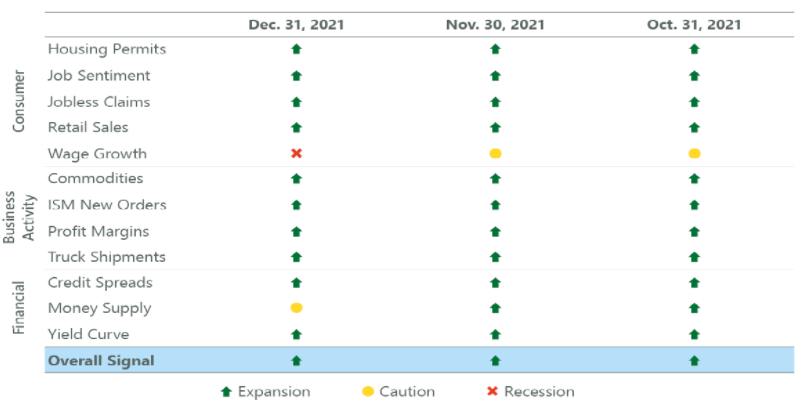
Data as of Dec. 31, 2021. Source: BLS, Federal Reserve, Census Bureau, ISM, BEA, American Chemistry Council, American Trucking Association, Conference Board, and Bloomberg. The ClearBridge Recession Risk Dashboard was created in January 2016. References to the signals it would have sent in the years prior to January 2016 are based on how the underlying data was reflected in the component indicators at the time.
The key macro debate for financial markets over the past 18 months has been inflation. Unfortunately, inflation will likely get worse over the next few months as easy comparisons from a year ago are lapped, although it should start to improve later in 2022 when comparisons become more challenging. There is more to the inflationary impulse than just comps, and by understanding the drivers of inflation one can better assess the path forward. Much of the excess inflation has been coming from used cars and other goods (ex-used cars), largely driven by shifting consumer preferences during the pandemic (services to goods) and compounded by supply chain constraints. As consumer preferences normalise during the transition to endemic, and as supply chain pressures abate, so too should inflation. From a historical perspective, core CPI has run at 4.9% over the last 12 months, which is 3.1% above the average 1.8% pace over the prior decade (2010–2019). Four categories of goods that combined make up 14% of the overall CPI basket accounted for almost two-thirds of the increase: new cars, used cars/trucks, apparel and household furnishings.
Exhibit 3: What’s Driving Inflation
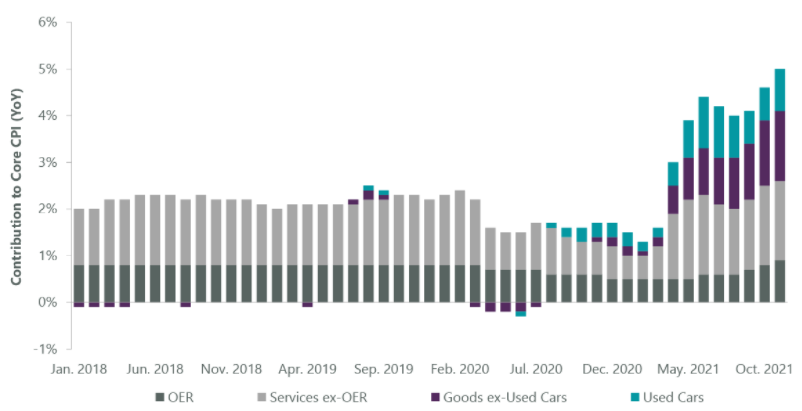
OER stands for Owners Equivalent Rent, the amount of rent that would have to be paid in order to substitute a currently owned house as a rental property. Data as of Nov. 30, 2021, latest available as of Dec. 31, 2021. Source: BLS, Bloomberg.
Furthermore, since the turn of the century, more than 100% of core CPI has come from services, with negative contribution from goods in large part due to globalisation keeping goods prices low. Even though services inflation has recently ticked higher, it remains broadly consistent with longer-term trends. For a persistently higher inflationary backdrop to emerge, however, goods prices would have to continue to rise. While there has been ample ink spilled about de-globalisation, the data suggest a stall, not a reversal. This means as we transition from pandemic to endemic, a transition back to slower inflation should also occur, given the lack of a goods price regime shift.
Exhibit 4: Goods Inflation Regime Shift?
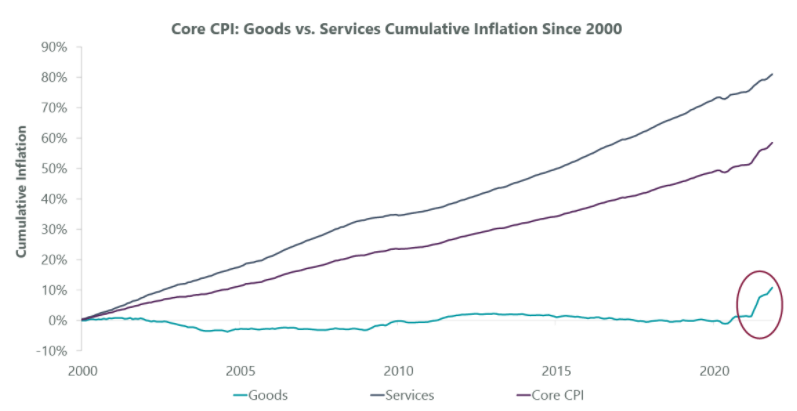
Data as of Nov. 30, 2021, latest available as of Dec 31, 2021. Source: BLS and Bloomberg.
One of the best ways to determine how the market views long-term inflation is through the lens of five-year, five-years forward breakevens (the pricing of five-year inflation expectations five years from now). This metric has been right in the middle of its trading range from the last decade, which means the market doesn’t expect (and has never expected) a meaningful transition in inflation over the long term. If a global pandemic, unprecedented fiscal and monetary expansion, countless supply chain disruptions, and 6%+ CPI readings can’t get the market to reprice inflation over the longer term, it’s hard to see what could lead to a shift in expectations. That said, our view is that inflationary pressure will begin to moderate in a few quarters and transition toward the Fed’s 2% target over the next few years.
Exhibit 5: Long Term Inflation Not a Concern
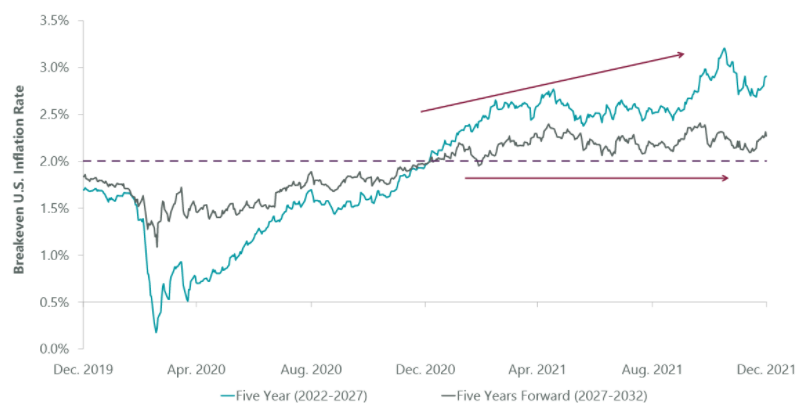
Five year period represents period from Jan. 2022 – Jan. 2027; five years forward represents period from Jan. 2027 – Jan. 2032. Data as of Dec. 31, 2021. Source: FactSet.
Another transition that has already begun and will continue in 2022 is the end of unbounded fiscal and monetary policy. The Fed is slowing QE purchases and has signaled that rate hikes may begin in the coming months. With inflation running well above target for longer than any expected, this hawkish turn makes sense. This shift also allows flexibility: should inflation begin to cool in the spring, the Fed can still shift its focus back toward the full employment half of its dual mandate and adopt a softer tone with regard to the timing of interest rate hikes. Currently, futures markets imply three rate hikes in 2022, and while more could occur, the markets are already expecting considerable monetary tightening in the year ahead. Despite this, history suggests that the initial rate hike could lead to near-term volatility in equity markets and a period of sideways price action.
Exhibit 6: Fed Liftoff, Market Breather
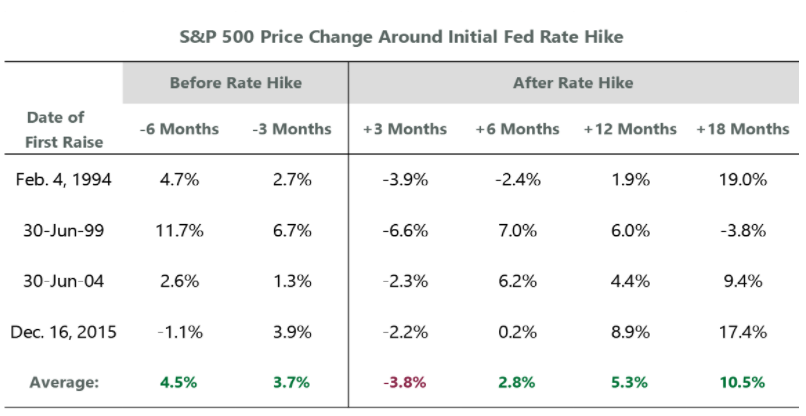
Source: FactSet. Data as of Dec. 31, 2021.
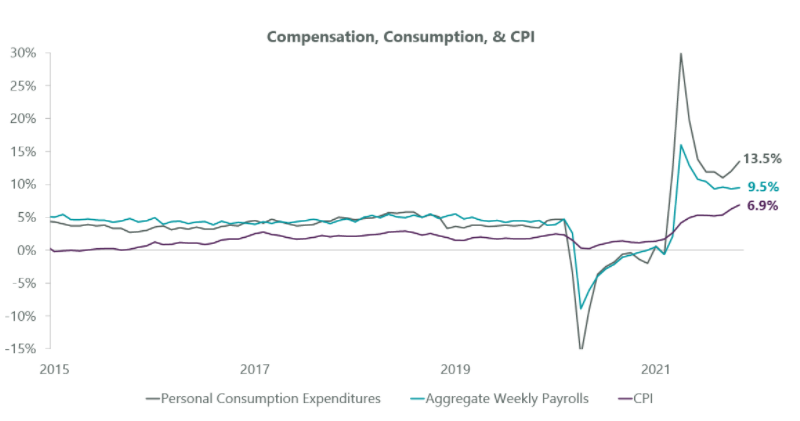
The ongoing saga of the Build Back Better (BBB) bill speaks to the transition on the fiscal policy side — compare the speed and ease with which the $1.9 trillion American Rescue Plan was passed in March 2021. The size of BBB has already been reduced several times amid a diminishing appetite for more fiscal support in a strong growth environment with above-target inflation. As a result, many investors are worried about the “fiscal cliff.” These fears appear overblown for several reasons. Much of the fiscal impulse in 2021 was focused toward income replacement, which is less necessary given the subsequent labor market recovery. Further, there is a very strong relationship between what workers earn and what they spend. With aggregate payrolls (hours worked × wages, at an aggregate level) well above the long-term average and easily outpacing inflation, workers have the means to continue spending in a healthy manner. This suggests that consumption, the backbone of the American economy, should hold up even in the face of waning fiscal support in 2022.
Fiscal cliff fears also assume that the entire increase in public deficits was spent and this year’s deficit reduction results in a GDP drag. While that may typically be the case, many households saved a portion of their transfer payments, as evidenced by the jump in savings rates in 2020. Although savings rates have normalised, there remains over $2 trillion in accumulated savings stockpiled, which could fund future spending. Finally, while the prospects may look bleak, a path forward for BBB has recently emerged. Taken together, the 2022 fiscal cliff may be more bark than bite.
Exhibit 7: Consumer Outlook Dependent on Wages
Earnings Key as Equities Face More Resistance
Given all these changes, gains in equity markets in the year ahead appear likely to come against a more labored backdrop with the potential for larger drawdowns. This dynamic is not uncommon during the transition to mid-cycle following the initial recovery, a similar backdrop seen in 1994 and 2011. The headwind for equities appears more likely to be multiples, with a healthy 8.5% consensus expectation for earnings growth in the year ahead and continued positive revisions to earnings estimates in recent months. Modest multiple compression is typical during this part of a new economic expansion, a dynamic we highlighted one year ago. P/Es did compress in 2021, and we believe further compression may occur in 2022 for similar reasons.
The good news is that earnings growth appears robust enough that the outlook for stocks on a full-year basis is solid, even though bouts of volatility may emerge. One thing that should support markets in the near term is retail participation in the market, which saw $913 billion in global equity inflows through the first 11 months of 2021. This is over 5x the $179 billion cumulative inflows seen since 1996. Importantly, January tends to be the strongest month for inflows, suggesting near-term volatility may remain muted before picking up later in 2022.
Exhibit 8: Retail Put
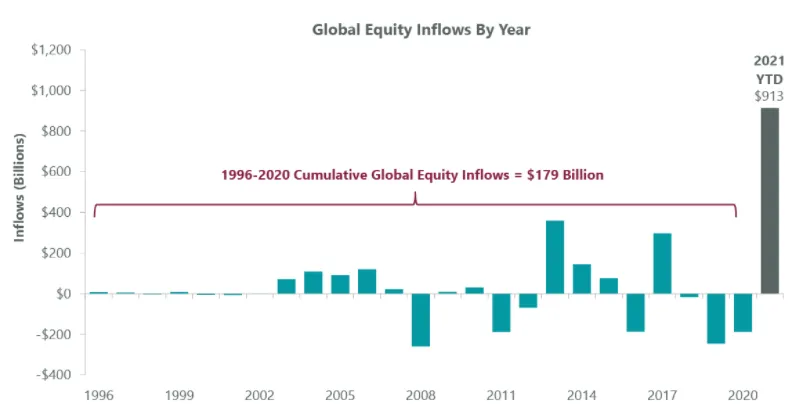
As of Nov. 30, 2021, latest available as of Dec. 31, 2021. Source: Goldman Sachs.
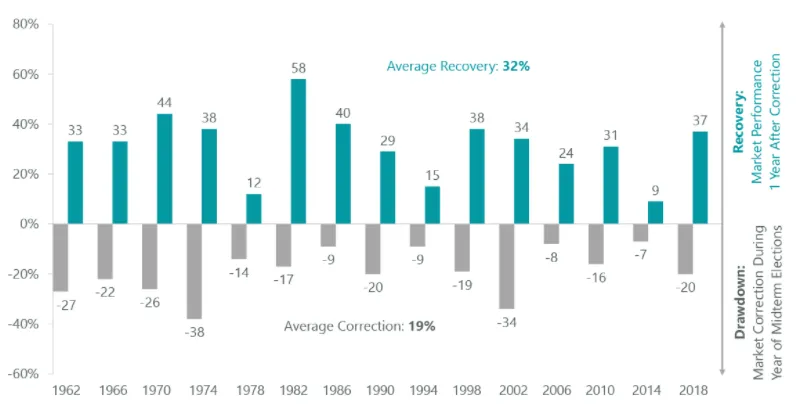
Another transition that could lead to market choppiness later in 2022 is the potential for a leadership shift in Washington. Historically, midterm election years see the largest intra-year drawdowns of any of the four years of a presidential cycle with an average decline of -19%. Although the midterms remain a distant thought for now, as the primaries edge closer and investors recalibrate expectations around potential legislative actions, this could become a source of volatility. Importantly, these pullbacks have historically been buying opportunities for longer-term investors, with a +32% rally on average in the year following the troughs of the midterm year drawdown.
Exhibit 9: Midterm Elections
Source: Standard & Poor’s, Bloomberg.
While 2022’s returns may pale in comparison to the outsized run the market has seen from the March 2020 pandemic lows, conditions remain supportive for further upside in equities in the years to come. Financial conditions remain accommodative and, though the Fed has become more hawkish, policy still remains quite easy compared with history. The U.S. economy has proven surprisingly resilient, and as subsequent variants hopefully become less disruptive, the healthy consumer, strong labor market and robust earnings backdrop should shine through. Taken together, the backdrop for corporate profits appears healthy enough to more than offset modest multiple compression and should drive another year of positive equity returns. Transitions are periods of change and while change can be unsettling, it is often both necessary and healthy. Consequently, financial markets may be choppier than recent history but should work their way higher as we move through this transition into the middle innings of this cycle.

Jeffrey Schulze, CFA, ClearBridge Investments, LLC
Related Perspectives
Anatomy of a Recession